
Page 367 - IJB-9-4
P. 367
International Journal of Bioprinting A computational model of cell viability and proliferation of 3D-bioprinted constructs
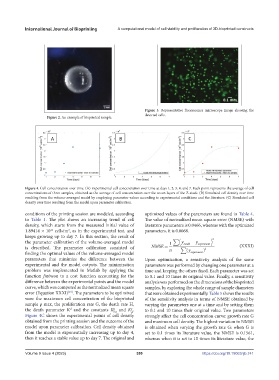
Figure 3. Representative fluorescence microscope image showing the
detected cells.
Figure 2. An example of bioprinted sample.
Figure 4. Cell concentration over time. (A) Experimental cell concentration over time at days 1, 2, 3, 4, and 7. Each point represents the average of cell
concentrations of three samples, obtained as the average of cell concentration over the seven layers of the Z-stack. (B) Simulated cell density over time
resulting from the volume-averaged model by employing parameter values according to experimental conditions and the literature. (C) Simulated cell
density over time resulting from the model upon parameter calibration.
conditions of the printing session are modeled, according optimized values of the parameters are found in Table 4.
to Table 1. The plot shows an increasing trend of cell The value of normalized mean square error (NMSE) with
density, which starts from the measured initial value of literature parameters is 0.0466, whereas with the optimized
1.89414 × 10 cells/m , as in the experimental test, and parameters, it is 0.0068.
3
11
keeps growing up to day 7. In this section, the result of 2
the parameter calibration of the volume-averaged model 1 ∑ y ( model − y experiment )
is described. The parameter calibration consisted of NMSE = n ∑ y ( ) 2 (XXXI)
finding the optimal values of the volume-averaged model experiment
parameters that minimize the difference between the Upon optimization, a sensitivity analysis of the same
experimental and the model outputs. The minimization parameters was performed by changing one parameter at a
problem was implemented in Matlab by applying the time and keeping the others fixed. Each parameter was set
function fmincon to a cost function accounting for the to 0.1 and 10 times its original value. Finally, a sensitivity
difference between the experimental points and the model analysis was performed on the dimensions of the bioprinted
curve, which was computed as the normalized mean square samples, by exploring the whole range of sample diameters
error (Equation XXXI) . The parameters to be optimized that were obtained experimentally. Table 5 shows the results
[23]
were the maximum cell concentration of the bioprinted of the sensitivity analysis in terms of NMSE obtained by
sample ρ max, the proliferation rate G, the death rate H, varying the parameters one at a time and by setting them
the death parameter K and the constants K and K . to 0.1 and 10 times their original value. Two parameters
d
g
g
O2
gl
Figure 4C shows the experimental points of cell density strongly affect the cell concentration curve: growth rate G
obtained from the printing session and the outcome of the and maximum cell density. The highest variation in NMSE
model upon parameter calibration. Cell density obtained is obtained when varying the growth rate G: when G is
from the model is exponentially increasing up to day 4, set to 0.1 times its literature value, the NMSE is 0.1561,
then it reaches a stable value up to day 7. The original and whereas when it is set to 10 times its literature value, the
Volume 9 Issue 4 (2023) 359 https://doi.org/10.18063/ijb.741