
Page 368 - IJB-9-4
P. 368
International Journal of Bioprinting A computational model of cell viability and proliferation of 3D-bioprinted constructs
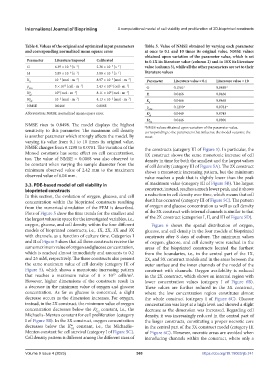
Table 4. Values of the original and optimized input parameters Table 5. Value of NMSE obtained by varying each parameter
and corresponding normalized mean square error at once to 0.1 and 10 times its original value. NMSE values
obtained upon variation of the parameter value, which is set
Parameter Literature/imposed Calibrated to 0.1X its literature value (column 2) and to 10X its literature
-1
-1
-6
G 6.39 × 10 [s ] 2.36 × 10 [s ] value (column 3), while all the other parameters are set to their
-5
H 3.89 × 10 [s ] 3.88 × 10 [s ] literature values
-5
-6
-1
-1
K 10 [mol ∙ m ] 8.97 × 10 [mol ∙ m ] Parameter Literature value × 0.1 Literature value × 10
-3
-3
-4
-4
d
ρ 5 × 10 [cell ∙ m ] 2.43 × 10 [cell ∙ m ] a a
12
-3
12
-3
max G 0.1561 0.8498
-3
K g gl 10 [mol ∙ m ] 8.11 × 10 [mol ∙ m ] H 0.0466 0.0468
-3
0
0
-3
-3
-2
K g O2 10 [mol ∙ m ] 4.13 × 10 [mol ∙ m ] K d 0.0466 0.0468
-2
NMSE 0.0466 0.0068 ρ 0.1290 a 0.0781 a
max
Abbreviation: NMSE, normalized mean square error. K g gl 0.0449 0.0743
K g O2 0.0446 0.0806
NMSE rises to 0.8498. The model displays the highest a NMSE values obtained upon variation of the parameter value,
sensitivity to this parameter. The maximum cell density corresponding to the parameters that influence the model outcome the
is another parameter which strongly affects the model. By most.
varying its value from 0.1 to 10 times its original value,
NMSE changes from 0.1290 to 0.0781. The variation of the the constructs (category III of Figure 5). In particular, the
Monod constants has some effect on cell concentration, 1X construct shows the same monotonic increase of cell
too. The value of NMSE = 0.0068 was also observed to density in time for both the smallest and the largest values
be constant when varying the sample diameter from the of cell density (category III of Figure 5A). The 2X construct
minimum observed value of 2.42 mm to the maximum shows a monotonic increasing pattern, but the minimum
observed value of 6.04 mm. value reaches a peak that is slightly lower than the peak
3.3. PDE-based model of cell viability in of maximum value (category III of Figure 5B). The largest
bioprinted constructs construct, instead, reaches a much lower peak, and it shows
In this section, the evolution of oxygen, glucose, and cell a reduction in cell density over time, which means that cell
concentration within the bioprinted constructs resulting death has occurred (category III of Figure 5C). The pattern
from the numerical simulation of the FEM is described. of oxygen and glucose concentration as well as cell density
Plots of Figure 5 show the time trends for the smallest and of the 3X construct with internal channels is similar to that
the largest values in space for the investigated variables, i.e., of the 2X construct (categories I, II, and III of Figure 5D).
oxygen, glucose, and cell density, within the four different Figure 6 shows the spatial distribution of oxygen,
models of bioprinted constructs, i.e., 1X, 2X, 3X and 3X glucose, and cell density in the four models of bioprinted
with channels, as a function of culture time. Categories I constructs after 8 days of culture. The minimum values
and II of Figure 5 show that all three constructs receive the of oxygen, glucose, and cell density were reached in the
same maximum value of oxygen and glucose concentration, areas of the bioprinted constructs located the furthest
which is reached almost immediately and amounts to 0.2 from the boundaries, i.e., in the central part of the 1X,
and 25 mM, respectively. The three constructs also present 2X, and 3X construct models and in the areas between the
the same maximum value of cell density (category III of outer surface and the inner channels of the model of the
Figure 5), which shows a monotonic increasing pattern construct with channels. Oxygen availability is reduced
that reaches a maximum value of 8 × 10 cells/m . in the 2X construct, which shows an internal region with
3
13
However, higher dimensions of the constructs result in lower concentration values (category I of Figure 6B).
a decrease in the minimum value of oxygen and glucose These values are further reduced in the 3X construct,
concentration. As far as glucose is concerned, a slight where the low concentration region constitutes almost
decrease occurs as the dimension increases. For oxygen, the whole construct (category I of Figure 6C). Glucose
instead, in the 2X construct, the minimum value of oxygen concentration was kept at a high level and showed a slight
concentration decreases below the K constant, i.e., the decrease as the dimension was increased. Regarding cell
g
O2
Michaelis–Menten constant for cell proliferation (category density, it was increasingly reduced in the central part of
I of Figure 5B). In the 3X construct, oxygen concentration the larger constructs, constituting a proper necrotic core
decreases below the K constant, i.e., the Michaelis– in the central part of the 3X construct model (category III
m
O2
Menten constant for cell survival (category I of Figure 5C). of Figure 6C). However, necrotic areas are avoided when
Cell density pattern is different among the different sizes of introducing channels within the construct, where only a
Volume 9 Issue 4 (2023) 360 https://doi.org/10.18063/ijb.741