
Page 365 - IJB-9-4
P. 365
International Journal of Bioprinting A computational model of cell viability and proliferation of 3D-bioprinted constructs
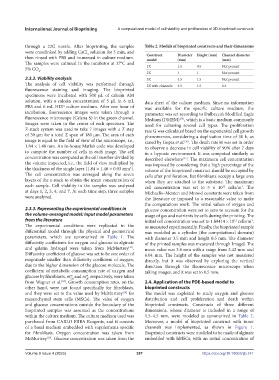
through a 22G nozzle. After bioprinting, the samples Table 2. Models of bioprinted constructs and their dimensions
were crosslinked by adding CaCl solution for 3 min, and Construct Diameter Height (mm) Channel diameter
2
then rinsed with PBS and immersed in culture medium. model (mm) (mm)
The samples were cultured in the incubator at 37°C and
5% CO . 1X 1.5 0.5 Not present
2
3
2X
Not present
1
2.3.2. Viability analysis 3X 4.5 1.5 Not present
The analysis of cell viability was performed through 3X with channels 4.5 1.5 0.4
fluorescence staining and imaging. The bioprinted
specimens were incubated with 500 µL of calcein AM
solution, with a calcein concentration of 5 µL in 6 mL data sheet of the culture medium. Since no information
PBS and 6 mL HDF culture medium. After one hour of was available for the specific culture medium, the
incubation, fluorescence images were taken through a parameter was set according to Dulbecco’s Modified Eagle
fluorescence microscope (Celena S) in the green channel. Medium (DMEM) , which is a basic medium commonly
[25]
Images were taken in the center of each specimen. The used for culturing several cell types. The proliferation
Z-stack system was used to take 7 images with a Z step rate G was calculated based on the exponential cell growth
of 30 µm for a total Z span of 180 µm. The area of each phenomenon, considering a duplication time of 30 h, as
image is equal to the field of view of the microscope, i.e., stated by Gupta et al. . The death rate H was set in order
[26]
1.84 × 1.48 mm. An in-house Matlab code was developed to observe a decrease in cell viability of 90% after 7 days
to compute the number of cells in each image. The cell in a hypoxic environment. It was computed similarly as
concentration was computed as the cell number divided by described elsewhere . The maximum cell concentration
[27]
the volume inspected, i.e., the field of view multiplied by was imposed by considering that a high percentage of the
the thickness of the single layer (1.84 × 1.48 × 0.03 mm ). volume of the bioprinted construct should be occupied by
3
The cell concentration was averaged along the seven cells after proliferation, but fibroblasts occupy a large area
layers of the z-stack to obtain the mean concentration of when they are attached to the substrate. The maximum
each sample. Cell viability in the samples was analyzed cell concentration was set to 5 × 10 cells/m . The
3
12
at days 1, 2, 3, 4, and 7. At each time step, three samples Michaelis–Menten and Monod constants were taken from
were analyzed. the literature or imposed to a reasonable value to make
the computations work. The initial values of oxygen and
2.3.3. Representing the experimental conditions in glucose concentration were set to zero to account for the
the volume-averaged model: Input model parameters usage of gas and nutrients by cells during the printing. The
from the literature initial cell concentration was set to 1.89414 × 10 cells/m ,
3
11
The experimental conditions were replicated in the as measured experimentally. Finally, the bioprinted sample
differential model through the physical and geometrical was modeled as a cylinder (the computational domain)
parameters, which are summarized in Table 1. The with diameter 3.5 mm and height 0.5 mm. The diameter
diffusivity coefficients for oxygen and glucose in alginate of the printed samples was measured through ImageJ. The
and gelatin hydrogel were taken from McMurtrey . mean value was 3.6 mm with a range from 2.42 mm and
[10]
Diffusivity coefficient of glucose was set to be one order of 6.04 mm. The height of the samples was not measured
magnitude smaller than diffusivity coefficient of oxygen, directly, but it was observed by exploring the vertical
due to the higher dimension of the glucose molecule. The direction through the fluorescence microscope when
coefficient of metabolic consumption rate of oxygen and taking images, and it was set to 0.5 mm.
glucose by fibroblasts, m and m , respectively, were taken
m
m
O2
gl
from Wagner et al. . Growth consumption rates, on the 2.4. Application of the PDE-based model to
[24]
other hand, were not found specifically for fibroblasts, bioprinted constructs
and they were set to the value used by McMurtrey for The model was exploited to study oxygen and glucose
[10]
mesenchymal stem cells (MSCs). The value of oxygen distribution and cell proliferation and death within
and glucose concentrations outside the boundary of the bioprinted constructs. Constructs of three different
bioprinted samples was assumed as the concentrations dimensions, whose diameter is included in a range of
within the culture medium. The culture medium used was 1.5–4.5 mm, were modeled as summarized in Table 2.
purchased from CARLO ERBA Reagents, and it consists Moreover, a model of bioprinted construct with inner
of a basal medium embedded with supplements specific channels was implemented, as shown in Figure 1.
for fibroblasts. Oxygen concentration was taken from Bioprinted constructs were modeled to be made of alginate
McMurtrey . Glucose concentration was taken from the embedded with hMSCs, with an initial concentration of
[10]
Volume 9 Issue 4 (2023) 357 https://doi.org/10.18063/ijb.741