
Page 412 - IJB-9-4
P. 412
International Journal of Bioprinting Development and characterization of AAMP for hydrogel bioink preparation
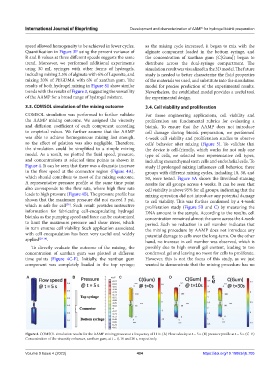
speed allowed homogeneity to be achieved in fewer cycles. as the mixing cycle increased, it began to mix with the
Quantification in Figure 3F using the percent variance of alginate component loaded in the bottom syringe, and
R and B values at three different speeds suggests the same the concentration of xanthan gum (C[Gum]) began to
trend. Moreover, we performed additional experiments distribute across the dual-syringe compartment. The
using 30 mL syringes with other forms of hydrogels, simulation result was visualized in the 3D model. The future
including mixing 2.5% of alginate with 6% of Laponite, and study is needed to better characterize the fluid properties
mixing 20% of PEGDMA with 6% of xanthan gum. The of the materials we used, and substitute into the simulation
results of both hydrogel mixing in Figure S1 show similar model for precise prediction of the experimental results.
trends with the results of Figure 3, suggesting the versatility Nevertheless, the established model provides a useful tool
of the AAMP for a broad range of hydrogel mixture. for experimental design.
3.3. COMSOL simulation of the mixing outcome 3.4. Cell viability and proliferation
COMSOL simulation was performed to further validate For tissue engineering applications, cell viability and
the AAMP mixing outcome. We assigned the viscosity proliferation are fundamental rubrics for evaluating a
and diffusion coefficient of each component according bioink. To ensure that the AAMP does not introduce
to empirical values. We further assume that the AAMP cell damage during bioink preparation, we performed
was able to achieve homogeneous mixing fast enough, 4-week cell viability and proliferation studies to observe
so the effect of gelation was also negligible. Therefore, cells’ behavior after mixing (Figure 5). To validate that
the simulation could be simplified to a simple mixing the device is cell-friendly, which works for not only one
model. As a result, we plotted the fluid speed, pressure, type of cells, we selected two representative cell types,
and concentrations at selected time points as shown in including mesenchymal stem cells and endothelial cells. To
Figure 4. It can be seen that there was a dramatic increase study if prolonged mixing influences cell behavior, three
in the flow speed at the connector region (Figure 4A), groups with different mixing cycles, including 10, 30, and
which should contribute to most of the mixing outcome. 50, were tested. Figure 5A shows the live/dead staining
A representative pressure profile at the same time point results for all groups across 4 weeks. It can be seen that
also corresponds to the flow rate, where high flow rate cell viability is above 95% for all groups, indicating that the
leads to high pressure (Figure 4B). The pressure profile has mixing operation did not introduce any potential damage
shown that the maximum pressure did not exceed 3 psi, to cell viability. This was further confirmed by a 4-week
which is safe for cell . Such result provides instructive proliferation study (Figure 5B and C) by measuring the
[28]
information for fabricating cell-encapsulating hydrogel DNA amount in the sample. According to the results, cell
bioinks as the pumping speed and force can be customized concentration remained almost the same across the 4-week
to limit the maximum pressure and shear stress, which period. Such no reduction in cell number indicates that
in turn ensures cell viability. Such application associated the mixing procedure by AAMP does not introduce any
with cell encapsulation has been very useful and widely potential damage to cells over the long-term. On the other
applied [29-34] . hand, no increase in cell number was observed, which is
To directly evaluate the outcome of the mixing, the possibly due to high overall gel content, leading to too
concentration of xanthan gum was plotted at different condensed gel and leaving no room for cells to proliferate.
time points (Figure 4C-E). Initially, the xanthan gum However, this is not the focus of this study, as we just
component was completely loaded in the top syringe; wanted to demonstrate that the mixing procedure has no
A B C D E
Figure 4. COMSOL simulation results for the AAMP mixing process at a frequency of 1 Hz. (A) Flow velocity at t = 5 s. (B) pressure profile at t = 5 s. (C–E)
Concentration of the viscosity enhancer, xanthan gum, at t = 0, 10 and 30 s, respectively.
Volume 9 Issue 4 (2023) 404 https://doi.org/10.18063/ijb.705