
Page 18 - IJB-9-5
P. 18
International Journal of Bioprinting 3D printed edible bird’s nests
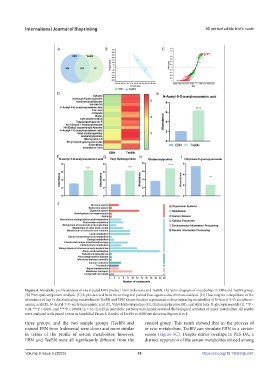
Figure 4. Metabolic profile analysis of one natural EBN product from Indonesia and TeeBN. (A) Venn diagram of metabolites in EBN and TeeBN group.
(B) Principal component analysis. (C) S-plot derived from the orthogonal partial least squares-discriminate analysis. (D) Heat map for comparison of the
abundance of top 19 discriminating metabolites in TeeBN and EBN. Quantification representative discriminating metabolites of N-Acetyl-9-O-acetylneur-
aminic acid (E), N-Acetyl-7-O-acetylneuraminic acid (F), Valyl-Hydroxyproline (G), Glutaminylproline (H), and ethyl beta-D-glucopyranoside (I). **P <
0.01, ***P < 0.001, and ****P < 0.0001 (n = 6). (J) KEGG metabolic pathway enrichment revealed the biological activities of major metabolites. All results
were analyzed with paired t-tests in GraphPad Prism 8. Results of TeeBN vs. EBN are shown in Figures E to I.
three groups, and the two sample groups (TeeBN and control group. This result showed that in the process of
natural EBN from Indonesia) were closer and more similar in vivo metabolism, TeeBN can simulate EBN to a certain
in terms of the profile of serum metabolites; however, extent (Figure 5C). Despite minor overlaps in PLS-DA, a
EBN and TeeBN were all significantly different from the distinct separation of the serum metabolites existed among
Volume 9 Issue 5 (2023) 10 https://doi.org/10.18063/ijb.691