
Page 19 - IJB-9-5
P. 19
International Journal of Bioprinting 3D printed edible bird’s nests
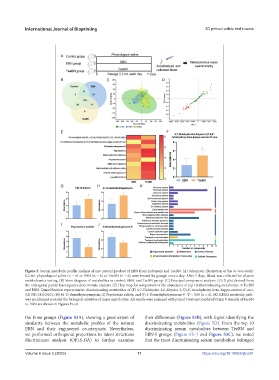
Figure 5. Serum metabolic profile analysis of one natural product of EBN from Indonesia and TeeBN. (A) Schematic illustration of the in vivo study:
0.2 mL physiological saline (n = 6) or EBN (n = 6) or TeeBN (n = 6) were treated by gavage, once a day. After 7 days, blood was collected for plasma
metabolomics testing. (B) Venn diagram of metabolites in control, EBN, and TeeBN group. (C) Principal component analysis. (D) S-plot derived from
the orthogonal partial least squares-discriminate analysis. (E) Heat map for comparison of the abundance of top 10 discriminating metabolites in TeeBN
and EBN. Quantification representative discriminating metabolites of (F) 6,7-Didehydro-5,6-dihydro-3,3’,5,8’-tetrahydroxy-beta, kappa-caroten-6’-one,
(G) PE (18:0/24:0), (H) 41-O-demethylrapamycin, (I) Psychosine sulfate, and (J) 3-Demethylubiquinone-9. *P < 0.05 (n = 6). (K) KEGG metabolic path-
way enrichment revealed the biological activities of major metabolites. All results were analyzed with paired t-tests in GraphPad Prism 8. Results of TeeBN
vs. EBN are shown in Figures F to J.
the three groups (Figure S3A), showing a great extent of their differences (Figure S3B), with S-plot identifying the
similarity between the metabolic profiles of the natural discriminating metabolites (Figure 5D). From the top 10
EBN and their engineered counterparts. Nevertheless, discriminating serum metabolites between TeeBN and
we performed orthogonal projections to latent structures EBN-I groups (Figure 5E–J and Figure S3C), we noted
discriminant analysis (OPLS-DA) to further examine that the most discriminating serum metabolites belonged
Volume 9 Issue 5 (2023) 11 https://doi.org/10.18063/ijb.691