
Page 308 - IJB-9-5
P. 308
International Journal of Bioprinting Scaffold for engineering enthesis organ
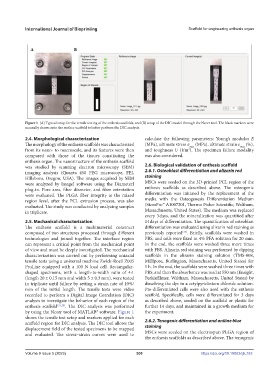
Figure 1. (A) Typical setup for the tensile testing of the enthesis scaffolds, and (B) setup of the DIC model through the Ncorr tool. The black markers were
manually drawn onto the surface scaffold to better perform the DIC analysis.
2.4. Morphological characterization calculate the following parameters: Young’s modulus E
The morphology of the enthesis scaffolds was characterized (MPa), ultimate stress σ max (MPa), ultimate strain ε max (%),
from its nano- to macroscale, and its features were then and toughness U (J/m ). The specimen failure modality
3
compared with those of the tissues constituting the was also considered.
enthesis organ. The nanostructure of the enthesis scaffold
was studied by scanning electron microscopy (SEM) 2.6. Biological validation of enthesis scaffold
imaging analysis (Quanta 450 FEG microscope, FEI, 2.6.1. Osteoblast differentiation and alizarin red
Hillsboro, Oregon, USA). The images acquired by SEM staining
were analyzed by ImageJ software using the DiameterJ MSCs were seeded on the 3D-printed PCL region of the
plug-in. Pore area, fiber diameter, and fiber orientation enthesis scaffolds as described above. The osteogenic
were evaluated. The PLGA fiber integrity at the mixed differentiation was initiated by the replacement of the
region level, after the PCL extrusion process, was also media with the Osteogenesis Differentiation Medium
evaluated. The study was conducted by analyzing samples (StemPro™ A1007201, Thermo Fisher Scientific, Waltham,
in triplicate. Massachusetts, United States). The medium was replaced
every 3 days, and the mineralization was quantified after
2.5. Mechanical characterization 14 days of differentiation. The quantification of osteoblast
The enthesis scaffold is a multimaterial construct differentiation was evaluated using alizarin red staining as
composed of two structures processed through different previously reported . Briefly, scaffolds were washed in
[33]
technologies and joined together. The interface region PBS, and cells were fixed in 4% PFA solution for 20 min.
can represent a critical point from the mechanical point In the end, the scaffolds were washed three more times
of view and must be deeply investigated. The mechanical with PBS. Alizarin red staining was performed by dipping
characterization was carried out by performing uniaxial scaffolds in the alizarin staining solution (TMS-008,
tensile tests using a universal machine Zwick-Roell Z005 Millipore, Burlington, Massachusetts, United States) for
ProLine equipped with a 100 N load cell. Rectangular- 1 h. In the end, the scaffolds were washed three times with
shaped specimens, with a length-to-width ratio of 4:1 PBS, and then the absorbance was read at 550 nm (Ensight,
(length 20 ± 0.15 mm and width 5 ± 0.3 mm), were tested PerkinElmer, Waltham, Massachusetts, United States) by
in triplicate until failure by setting a strain rate of 10%/ dissolving the dye in a cetylpyridinium chloride solution.
min of the initial length. The tensile tests were video Pre-differentiated cells were also used with the enthesis
recorded to perform a Digital Image Correlation (DIC) scaffold. Specifically, cells were differentiated for 3 days
analysis to investigate the behavior of each region of the as described above, seeded on the scaffold or plastic for
enthesis scaffold [31,32] . The DIC analysis was performed further 14 days, and maintained in a growth medium for
by using the Ncorr tool of MATLAB® software. Figure 1 the experiment.
shows the tensile test setup and markers applied for each
scaffold region for DIC analysis. The DIC tool allows the 2.6.2. Tenogenic differentiation and aniline blue
displacement field of the tested specimens to be mapped staining
and evaluated. The stress–strain curves were used to MSCs were seeded on the electrospun PLGA region of
the enthesis scaffolds as described above. The tenogenic
Volume 9 Issue 5 (2023) 300 https://doi.org/10.18063/ijb.763