
Page 312 - IJB-9-5
P. 312
International Journal of Bioprinting Scaffold for engineering enthesis organ
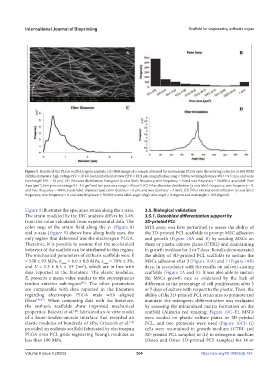
Figure 5. Results of the PLGA scaffold region analysis. (A) SEM image of a sample obtained by electrospun PLGA onto the rotating collector at 800 RPM
(SEM parameters: high voltage HV = 10 kV, horizontal field of view HFV = 82.9 µm, magnification mag = 5000x, working distance WD = 9.5 mm, and scale
bare length SBL = 20 µm). (B) Pore area distribution histogram (y-axis label: frequency, min frequency = 0 and max frequency = 50,000; x-axis label: Pore
2
2
2
Area (µm ), first pore area range 0.1–4.6 µm and last pore area range > 40 µm ). (C) Fiber diameter distribution (y-axis label: frequency, min frequency = 0,
and max frequency = 6000; x-axis label: diameter (µm), min diameter = 0 µm, and max diameter = 4 mm). (D) Fiber orientation distribution (y-axis label:
frequency, min frequency = 0 and max frequency = 50,000; x-axis label: angle (deg), min angle = 0 degrees and max angle = 180 degrees).
Figure 9 illustrates the specimen strain along the x-axis. 3.5. Biological validation
The strain modeled by the DIC analysis differs by 3.4% 3.5.1. Osteoblast differentiation support by
from the value calculated from experimental data. The 3D-printed PCL
color map of the strain field along the y- (Figure 8) MTS assay was first performed to assess the ability of
and x-axis (Figure 9) shows how along both axes, the the 3D-printed PCL scaffolds to prompt MSC adhesion
only region that deformed was the electrospun PLGA. and growth (Figure 10A and B) by seeding MSCs on
Therefore, it is possible to assume that the mechanical them or plastic culture plates (CTRL) and maintaining
behavior of the scaffold can be attributed to this region. in growth medium for 3 or 7 days. Results demonstrated
The mechanical parameters of enthesis scaffolds were E the ability of 3D-printed PCL scaffolds to sustain the
= 530 ± 93 MPa, σ max = 6.0 ± 0.8 MPa, ε max = 70% ± 3%, MSCs adhesion after 3 (Figure 10A) and 7 (Figure 10B)
and U = 1.3 ± 0.5 × 10 J/m ), which are in line with days, in accordance with the results on solvent-casting
6
3
data reported in the literature. The elastic modulus, scaffolds (Figure 2A and B). It was also able to sustain
E, presents a mean value similar to the supraspinatus the MSCs growth rate as evidenced by the lack of
tendon anterior sub-region [45] . The other parameters difference in the percentage of cell proliferation after 3
are comparable with data reported in the literature or 7 days of culture with respect to the plastic. Then, the
regarding electrospun PLGA mats with aligned ability of the 3D-printed PCL structures to promote and
fibers [46,47] . When comparing data with the literature, maintain the osteogenic differentiation was evaluated
the enthesis scaffolds show improved mechanical by assessing the mineralized matrix formation on the
properties: Balestri et al. [48] fabricated an in vitro model scaffold (Alizarin red staining; Figure 10C–F). MSCs
of a bone–tendon–muscle interface that recorded an were seeded on plastic culture plates or 3D-printed
elastic modulus of hundreds of kPa; Criscenti et al. [12] PCL, and two protocols were used (Figure 10C): (i)
provided an enthesis scaffold fabricated by electrospun cells were maintained in growth medium (CTRL and
PLGA onto PCL grids registering Young’s modulus as 3D-printed PCL samples) or (ii) in osteogenic medium
less than 100 MPa. (Osteo and Osteo 3D-printed PCL samples) for 14 or
Volume 9 Issue 5 (2023) 304 https://doi.org/10.18063/ijb.763