
Page 314 - IJB-9-5
P. 314
International Journal of Bioprinting Scaffold for engineering enthesis organ
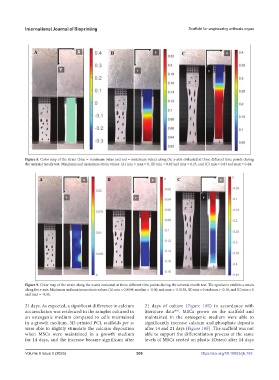
Figure 8. Color map of the strain (blue = minimum value and red = maximum value) along the y-axis evaluated at three different time points during
the uniaxial tensile test. Minimum and maximum strain values: (A) min = max = 0, (B) min = 0.02 and max = 0.23, and (C) min = 0.03 and max = 0.44.
Figure 9. Color map of the strain along the x-axis evaluated at three different time points during the uniaxial tensile test. The specimen exhibits a strain
along the x-axis. Minimum and maximum strain values: (A) min = 0.0144, median = -0.00, and max = -0.0138, (B) min = 0 and max = -0.18, and (C) min = 0
and max = -0.45.
21 days. As expected, a significant difference in calcium 21 days of culture (Figure 10E) in accordance with
accumulation was evidenced in the samples cultured in literature data [49] . MSCs grown on the scaffold and
an osteogenic medium compared to cells maintained maintained in the osteogenic medium were able to
in a growth medium. 3D-printed PCL scaffolds per se significantly increase calcium and phosphate deposits
were able to slightly stimulate the calcium deposition after 14 and 21 days (Figure 10F). The scaffold was not
when MSCs were maintained in a growth medium able to support the differentiation process at the same
for 14 days, and the increase became significant after levels of MSCs seeded on plastic (Osteo) after 14 days
Volume 9 Issue 5 (2023) 306 https://doi.org/10.18063/ijb.763