
Page 179 - v11i4
P. 179
International Journal of Bioprinting Design of SLM-Ta artificial vertebral body
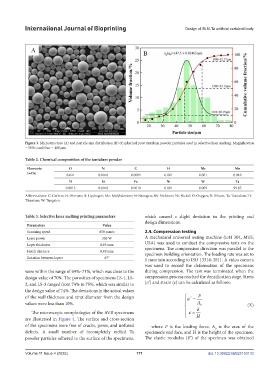
Figure 3. Microstructure (A) and particle size distribution (B) of spherical pure tantalum powder particles used in selective laser melting. Magnification
= 500×; scale bar = 100 μm.
Table 2. Chemical composition of the tantalum powder
Elements O N C H Nb Mo
(wt%) 0.021 0.0018 0.0009 0.001 0.001 0.010
Ti Si Fe Ni W Ta
0.0013 0.0018 0.0018 0.001 0.009 99.95
Abbreviations: C: Carbon; Fe: Ferrum; H: Hydrogen; Mo: Molybdenum; N: Nitrogen; Nb: Niobium; Ni: Nickel; O: Oxygen; Si: Silicon; Ta: Tantalum; Ti:
Titanium; W: Tungsten.
Table 3. Selective laser melting printing parameters which caused a slight deviation in the printing and
design dimensions.
Parameters Value
Scanning speed 650 mm/s 2.4. Compression testing
Laser power 350 W A mechanical universal testing machine (E44 304, MTS,
Layer thickness 0.03 mm USA) was used to conduct the compressive tests on the
specimens. The compression direction was parallel to the
Hatch distance 0.08 mm specimen building orientation. The loading rate was set to
Rotation between layers 67° 1 mm/min according to ISO 13314: 2011. A video camera
was used to record the deformation of the specimens
were within the range of 69%–71%, which was close to the during compression. The test was terminated when the
design value of 70%. The porosities of specimens LS-1, LS- compression process reached the densification stage. Stress
*
2, and LS-3 ranged from 74% to 75%, which was similar to (σ ) and strain (ε) can be calculated as follows:
the design value of 74%. The deviations in the actual values
of the wall thickness and strut diameter from the design F
*
values were less than 10%. A 0 (X)
The microscopic morphologies of the AVB specimens
are illustrated in Figure 4. The surface and cross-section H
of the specimens were free of cracks, pores, and unfused where F is the loading force, A is the area of the
0
defects. A small number of incompletely melted Ta specimen’s end face, and H is the height of the specimen.
*
powder particles adhered to the surface of the specimens, The elastic modulus (E ) of the specimen was obtained
Volume 11 Issue 4 (2025) 171 doi: 10.36922/IJB025150133