
Page 427 - v11i4
P. 427
International Journal of Bioprinting Swelling–shrinking behavior of hydrogel
filament should be minimized. To identify the optimal of the biomimetic structure in cell culturing or tissue
RH levels for hydrogel 3D printing, horizontal dashed engineering.
lines corresponding to an H2/H1 of 1 are included in Therefore, based on the deformation trends obtained
Figure 7B–D. The geometric variation of the 0.2 mm from the simulations, the RH level corresponding to the
filament reaches the greatest moderation at 90% RH. For minimal deviation from an H2/H1 of 1 was selected as
the 0.3 mm filament, both the curves of the 80 and 90%
RHs demonstrate lower deviations from the dashed line. the optimal RH for each filament diameter. According
Similarly, for the 0.4 mm filament, the geometric variation to the calculation results, the optimal RH levels for the
presents the lowest alleviation at 60 and 70% RHs. 3D printing process of the 0.2, 0.3, and 0.4 mm hydrogel
filaments were 90, 80, and 60%, respectively.
In practice, the challenges posed by humidity-driven
swelling are more severe than those of humidity-driven 3.2. Experimental validation of the
shrinking. During the layer-by-layer deposition process, simulation results
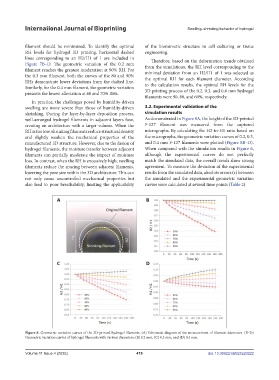
well-arranged hydrogel filaments in adjacent layers fuse, As demonstrated in Figure 8A, the height of the 3D-printed
creating an architecture with a larger volume. When the F-127 filament was measured from the captured
RH is too low, shrinking filaments reduce structural density micrographs. By calculating the H2-to-H1 ratio based on
and slightly weaken the mechanical properties of the the micrographs, the geometric variation curves of 0.2, 0.3,
manufactured 3D structure. However, due to the fusion of and 0.4 mm F-127 filaments were plotted (Figure 8B–D).
hydrogel filaments, the moisture transfer between adjacent When compared with the simulation results in Figure 6,
filaments can partially moderate the impact of moisture although the experimental curves do not perfectly
loss. In contrast, when the RH is excessively high, swelling match the simulated data, the overall trends show strong
filaments reduce the spacing between adjacent filaments, agreement. To measure the deviation of the experimental
lowering the pore size within the 3D architecture. This can results from the simulated data, absolute errors (ε) between
not only cause uncontrolled mechanical properties but the simulated and the experimental geometric variation
also lead to poor breathability, limiting the applicability curves were calculated at several time points (Table 2).
Figure 8. Geometric variation curves of the 3D-printed hydrogel filaments. (A) Schematic diagram of the measurement of filament diameters. (B–D)
Geometric variation curves of hydrogel filaments with various diameters: (B) 0.2 mm, (C) 0.3 mm, and (D) 0.4 mm.
Volume 11 Issue 4 (2025) 419 doi: 10.36922/IJB025220222