
Page 423 - v11i4
P. 423
International Journal of Bioprinting Swelling–shrinking behavior of hydrogel
filaments with various diameters under the RH of 50% are as mean ± standard deviation. Statistical significance was
demonstrated in Figure 3. evaluated using one-way analysis of variance (ANOVA)
followed by Tukey’s Honestly Significant Difference test for
2.4. Preparation of 3D-printed ear model post-hoc comparisons. A p-value < 0.05 was considered
The widely adopted F-127 hydrogel was employed for the statistically significant.
3D printing trials. Before the experiment, the 30% (w/v)
F-127 solution was prepared and stained with red ink 3. Results and discussion
to facilitate the microscopic observation of the printed
structures. Three digital models of human ears with 3.1. Analysis of the calculation results
identical shapes but various sizes were designed, with The numerical investigation of the humidity-driven
a height ratio of 2:3:4. For the smallest ear model, F-127 swelling–shrinking behavior was conducted based on
was extruded through a 0.2 mm nozzle under ambient RH three types of printed filaments with diameters of 0.2, 0.3,
levels of 90 and 80%. For the medium-sized ear model, and 0.4 mm. For the evaporation process of each hydrogel
a 0.3 mm nozzle was adopted, and the ambient RH was filament, the initial RH was set to 50, 60, 70, 80, and 90%.
controlled at 80 and 70%. Lastly, for the largest ear model, To mimic the actual working conditions of the extrusion
F-127 material was printed employing a 0.4 mm nozzle process, the cold source and room temperature were set
under the ambient RH of 60 and 50%. To evaluate the print to 25°C.
quality of each 3D architecture, photographs of the overall Figure 4 illustrates the transient-state RH distribution
view were taken using an electronic digital microscope
(Inskam-316, Aomekie, USA), while top-view micrographs in the ambient air of the 0.2 mm filaments. The continuous
were taken using an optical microscope (PH50-3A43L- movement of the fluid–fluid interface reflects the geometric
A1600X, Phenix, China). variation of each hydrogel filament during the evaporation
process. As presented in the figure, high-humidity moist
2.5. Statistical analysis air is gathered near the printed filament. Due to the
All experimental results were obtained from at least three water vapor diffusion from the hydrogel material, the
independent replicates. For each group, data are presented humidity field in the ambient air domain demonstrates a
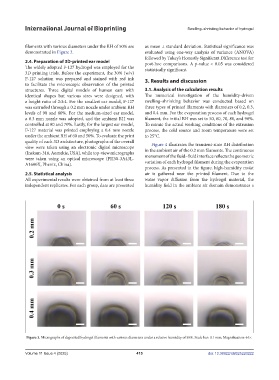
Figure 3. Micrographs of deposited hydrogel filaments with various diameters under a relative humidity of 50%. Scale bar: 0.1 mm; Magnification: 64×.
Volume 11 Issue 4 (2025) 415 doi: 10.36922/IJB025220222