
Page 428 - v11i4
P. 428
International Journal of Bioprinting Swelling–shrinking behavior of hydrogel
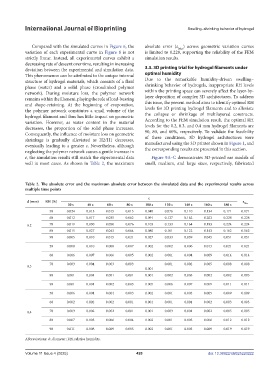
Compared with the simulated curves in Figure 6, the absolute error (ε Max ) across geometric variation curves
variation of each experimental curve in Figure 8 is not is limited to 0.228, supporting the reliability of the FEM
strictly linear. Instead, all experimental curves exhibit a simulation results.
decreasing rate of descent over time, resulting in increasing
deviation between the experimental and simulation data. 3.3. 3D printing trial for hydrogel filaments under
This phenomenon can be attributed to the unique internal optimal humidity
structure of hydrogel materials, which consists of a fluid Due to the remarkable humidity-driven swelling–
phase (water) and a solid phase (crosslinked polymer shrinking behavior of hydrogels, inappropriate RH levels
network). During moisture loss, the polymer network within the printing space can severely affect the layer-by-
remains within the filament, playing the role of load-bearing layer deposition of complex 3D architectures. To address
and shape-retaining. At the beginning of evaporation, this issue, the present method aims to identify optimal RH
the polymer network constitutes a small volume of the levels for 3D printing hydrogel filaments and to alleviate
hydrogel filament and thus has little impact on geometric the collapse or shrinkage of multilayered constructs.
variation. However, as water content in the material According to the FEM simulation result, the optimal RH
decreases, the proportion of the solid phase increases. levels for the 0.2, 0.3, and 0.4 mm hydrogel filaments are
Consequently, the influence of moisture loss on geometric 90, 80, and 60%, respectively. To validate the feasibility
shrinkage is gradually alleviated as H2/H1 decreases, of these conditions, 3D hydrogel architectures were
eventually leading to a greater ε. Nevertheless, although manufactured using the 3D printer shown in Figure 1, and
neglecting the polymer network causes a gentle increase in the corresponding results are presented in this section.
ε, the simulation results still match the experimental data Figure 9A–C demonstrates 3D-printed ear models of
well in most cases. As shown in Table 2, the maximum small, medium, and large sizes, respectively, fabricated
Table 2. The absolute error and the maximum absolute error between the simulated data and the experimental results across
multiple time points
ε
d (mm) RH (%) ε
20 s 40 s 60 s 80 s 100 s 120 s 140 s 160 s 180 s Max
50 0.024 0.015 0.015 0.015 0.040 0.076 0.110 0.134 0.171 0.171
60 0.012 0.017 0.035 0.062 0.091 0.127 0.162 0.202 0.228 0.228
0.2 70 0.019 0.030 0.050 0.076 0.103 0.133 0.164 0.193 0.224 0.224
80 0.015 0.027 0.043 0.064 0.080 0.101 0.122 0.143 0.162 0.162
90 0.005 0.010 0.015 0.021 0.027 0.033 0.039 0.045 0.051 0.051
50 0.008 0.010 0.008 0.007 0.002 0.002 0.006 0.013 0.021 0.021
60 0.006 0.007 0.006 0.005 0.002 0.001 0.004 0.009 0.014 0.014
70 0.003 0.004 0.003 0.003 0.001 0.002 0.005 0.008 0.008
0.3
0.001
80 0.001 0.001 0.001 0.001 0.001 0.002 0.005 0.002 0.002 0.005
90 0.001 0.001 0.002 0.003 0.005 0.006 0.007 0.009 0.011 0.011
50 0.006 0.004 0.004 0.003 0.002 0.001 0.003 0.005 0.009 0.009
60 0.002 0.002 0.002 0.001 0.001 0.001 0.001 0.002 0.003 0.003
0.4 70 0.003 0.002 0.002 0.001 0.001 0.003 0.001 0.002 0.005 0.005
80 0.007 0.005 0.006 0.004 0.002 0.001 0.003 0.006 0.012 0.012
90 0.011 0.008 0.009 0.005 0.003 0.001 0.005 0.009 0.019 0.019
Abbreviations: d:, diameter; RH, relative humidity.
Volume 11 Issue 4 (2025) 420 doi: 10.36922/IJB025220222