
Page 61 - v11i4
P. 61
International Journal of Bioprinting 3D bioprinting of nerve guidance conduits
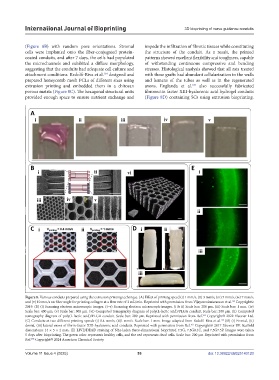
(Figure 8B) with random pore orientations. Stromal impede the infiltration of fibrotic tissues while constituting
cells were implanted onto the fiber-conjugated protein- the structure of the conduit. As a result, the printed
coated conduits, and after 7 days, the cells had populated patterns showed excellent flexibility and toughness, capable
the microchannels and exhibited a diffuse morphology, of withstanding continuous compressive and bending
suggesting that the conduits had adequate cell culture and stresses. Histological analysis showed that all rats treated
attachment conditions. Redolfi-Riva et al. designed and with these grafts had abundant cellularization in the walls
164
prepared honeycomb mesh PCLs of different sizes using and lumens of the tubes as well as in the regenerated
extrusion printing and embedded them in a chitosan axons. Englanda et al. also successfully fabricated
165
porous matrix (Figure 8C). The hexagonal structural units fibronectin factor XIII-hyaluronic acid hydrogel conduits
provided enough space to ensure nutrient exchange and (Figure 8D) containing SCs using extrusion bioprinting.
Figure 8. Various conduits prepared using the extrusion printing technique. (A) Effect of printing speed (i) 1 mm/s, (ii) 3 mm/s, (iii) 5 mm/s, (iv) 7 mm/s,
and (v) 10 mm/s on fiber angle for printing collagen at a flow rate of 3 mL/min. Reprinted with permission from Vijayavenkataraman et al. Copyright©
162
2019. (B) (i) Scanning electron microscopic images. (i–v) Scanning electron microscopic images. (i & ii) Scale bar: 200 μm. (iii) Scale bar: 1 mm. (iv)
Scale bar: 400 μm. (v) Scale bar: 500 μm. (vi) Computed tomography diagram of poly(L-lactic acid)/PLGA conduit. Scale bar: 200 μm. (ii) Computed
tomography diagram of poly(L-lactic acid)/PLGA conduit. Scale bar: 200 μm. Reprinted with permission from Ref. Copyright© 2022 Elsevier Ltd.
163
(C) Conduits at two different printing speeds (i) 0.4 mm/s, (ii)1 mm/s. Scale bar: 1 mm. Image adapted from Redolfi-Riva et al. (D) (i) Frontal, (ii)
164
dorsal, (iii) lateral views of fibrin-factor XIII-hyaluronic acid conduits. Reprinted with permission from Ref. Copyright© 2017 Elsevier BV. Scaffold
165
dimensions: 14 × 5 × 2 mm. (E) LIVE/DEAD staining of N2a-laden three-dimensional bioprinted 7.5G, 7.5G0.1C, and 7.5G7.5P. Images were taken
5 days after bioprinting. The green color represents healthy cells, and the red represents dead cells. Scale bar: 200 μm Reprinted with permission from
Ref. Copyright© 2024 American Chemical Society.
166
Volume 11 Issue 4 (2025) 53 doi: 10.36922/IJB025140120