
Page 105 - IJOCTA-15-3
P. 105
Application of Jumarie-Stancu collocation series method and multi-Step
(a) (b)
(c) (d)
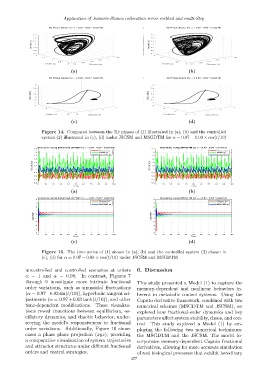
Figure 14. Compared between the 3D phases of (1) illustrated in (a), (b) and the controlled
system (2) illustrated in (c), (d) under JSCSM and MSGDTM for α = 0.97 − 0.03 × cos(t/10)
Dynamics using Enhanced LRPSM for = 0.97 - 0.03 * cos(t/10) Dynamics using MSGDTM for = 0.97 - 0.03 * cos(t/10)
2.2 2.2
Glucose (x) Glucose (x)
2 Insulin (y) 2 Insulin (y)
Beta-cells (z) Beta-cells (z)
1.8 1.8
1.6 1.6
Concentration 1.4 Concentration 1.4
1.2
1.2
0.8 1 0.8 1
0.6 0.6
0.4 0.4
0.2 0.2
0 10 20 30 40 50 60 70 80 90 100 0 10 20 30 40 50 60 70 80 90 100
Time Time
(a) (b)
Dynamics using Enhanced LRPSM for = 0.97 - 0.03 * cos(t/10) Dynamics using MSGDTM for = 0.97 - 0.03 * cos(t/10)
4 4
Glucose (x) Glucose (x)
3 Insulin (y) 3 Insulin (y)
Beta-cells (z) Beta-cells (z)
2 2
1 1
Concentration -1 0 Concentration -1 0
-2 -2
-3 -3
-4 -4
-5 -5
0 10 20 30 40 50 60 70 80 90 100 0 10 20 30 40 50 60 70 80 90 100
Time Time
(c) (d)
Figure 15. The time series of (1) shown in (a), (b) and the controlled system (2) shown in
(c), (d) for α = 0.97 − 0.03 × cos(t/10) under JSCSM and MSGDTM
uncontrolled and controlled scenarios at orders 6. Discussion
α = 1 and α = 0.98. In contrast, Figures 7
through 9 investigate more intricate fractional This study presented a Model (1) to capture the
order variations, such as sinusoidal fluctuations memory-dependent and nonlinear behaviors in-
(α = 0.97−0.03 sin(t/10)), hyperbolic tangent ad- herent in metabolic control systems. Using the
justments (α = 0.97+0.03 tanh(t/10)), and other Caputo derivative framework, combined with two
time-dependent modifications. These visualiza- numerical schemes (MSGDTM and JSCSM), we
tions reveal transitions between equilibrium, os- explored how fractional-order dynamics and key
cillatory dynamics, and chaotic behavior, under- parameters affect system stability, chaos, and con-
scoring the model’s responsiveness to fractional trol. This study explored a Model (1) by em-
order variations. Additionally, Figure 10 show- ploying the following two numerical techniques:
cases a phase plane projection (xyz), providing the MSGDTM and the JSCSM. The model in-
a comparative visualization of system trajectories corporates memory-dependent Caputo fractional
and attractor structures under different fractional derivatives, allowing for more accurate simulation
orders and control strategies. of real biological processes that exhibit hereditary
477