Page 100 - IJOCTA-15-3
P. 100

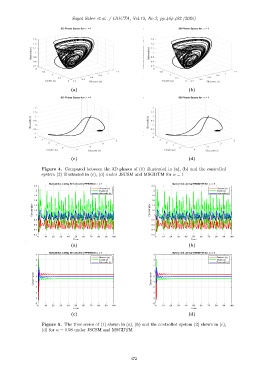
Sayed Saber et.al. / IJOCTA, Vol.15, No.3, pp.464-482 (2025)


                                 (a)                                                 (b)


                                 (c)                                                 (d)
                    Figure 4. Compared between the 3D phases of (1) illustrated in (a), (b) and the controlled
                    system (2) illustrated in (c), (d) under JSCSM and MSGDTM for α = 1

                       Dynamics using Enhanced LRPSM for   = 1                Dynamics using MSGDTM for   = 1
                2.2                                                 2.2
                                             Glucose (x)                                         Glucose (x)
                 2                           Insulin (y)             2                           Insulin (y)
                                             Beta-cells (z)                                      Beta-cells (z)
                1.8                                                 1.8
                1.6                                                 1.6
               Concentration  1.4 1                                 Concentration  1.4 1
                1.2
                                                                    1.2
                0.8                                                 0.8
                0.6                                                 0.6
                0.4                                                 0.4
                0.2                                                 0.2
                  0  10  20  30  40  50  60  70  80  90  100          0  10  20  30  40  50  60  70  80  90  100
                                  Time                                                Time
                                 (a)                                                 (b)
                       Dynamics using Enhanced LRPSM for   = 1                Dynamics using MSGDTM for   = 1
                 4                                                   4
                                             Glucose (x)                                         Glucose (x)
                 3                           Insulin (y)             3                           Insulin (y)
                                             Beta-cells (z)                                      Beta-cells (z)
                 2                                                   2
                 1                                                   1
                Concentration  -1 0                                 Concentration  -1 0
                 -2                                                  -2
                 -3                                                  -3
                 -4                                                  -4
                 -5                                                  -5
                  0  10  20  30  40  50  60  70  80  90  100          0  10  20  30  40  50  60  70  80  90  100
                                  Time                                                Time
                                 (c)                                                 (d)
                    Figure 5. The time series of (1) shown in (a), (b) and the controlled system (2) shown in (c),
                    (d) for α = 0.98 under JSCSM and MSGDTM


                                                           472
   95   96   97   98   99   100   101   102   103   104   105