
Page 103 - IJOCTA-15-3
P. 103
Application of Jumarie-Stancu collocation series method and multi-Step
(a) (b)
(c)
(d)
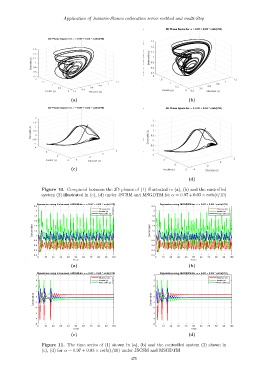
Figure 10. Compared between the 3D phases of (1) illustrated in (a), (b) and the controlled
system (2) illustrated in (c), (d) under JSCSM and MSGDTM for α = 0.97 + 0.03 × coth(t/10)
Dynamics using Enhanced LRPSM for = 0.97 + 0.03 * coth(t/10) Dynamics using MSGDTM for = 0.97 + 0.03 * coth(t/10)
2.2 2.2
Glucose (x) Glucose (x)
2 Insulin (y) 2 Insulin (y)
Beta-cells (z) Beta-cells (z)
1.8 1.8
1.6 1.6
Concentration 1.4 Concentration 1.4
1.2
1.2
0.8 1 0.8 1
0.6 0.6
0.4 0.4
0.2 0.2
0 10 20 30 40 50 60 70 80 90 100 0 10 20 30 40 50 60 70 80 90 100
Time Time
(a) (b)
Dynamics using Enhanced LRPSM for = 0.97 + 0.03 * coth(t/10) Dynamics using MSGDTM for = 0.97 + 0.03 * coth(t/10)
4 4
Glucose (x) Glucose (x)
3 Insulin (y) 3 Insulin (y)
Beta-cells (z) Beta-cells (z)
2 2
1 1
Concentration -1 0 Concentration -1 0
-2 -2
-3 -3
-4 -4
-5 -5
0 10 20 30 40 50 60 70 80 90 100 0 10 20 30 40 50 60 70 80 90 100
Time Time
(c) (d)
Figure 11. The time series of (1) shown in (a), (b) and the controlled system (2) shown in
(c), (d) for α = 0.97 + 0.03 × coth(t/10) under JSCSM and MSGDTM
475