
Page 154 - IJOCTA-15-4
P. 154
Mengxue Li et al. / IJOCTA, Vol.15, No.4, pp.686-705 (2025)
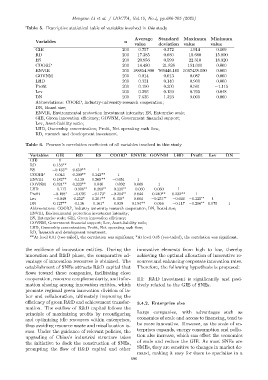
Table 5. Descriptive statistical table of variables involved in this study
Average Standard Maximum Minimum
Variables n
value deviation value value
GIE 200 0.757 0.372 1.914 0.109
RD 200 17.385 0.680 19.680 15.800
ES 200 20.956 0.599 22.310 18.920
COORP 200 14.490 21.826 151.000 0.000
ENVIR 200 188854.800 769446.100 5067438.000 0.000
GOVNM 200 0.014 0.013 0.087 0.000
LHD 200 0.321 0.140 0.900 0.000
Profit 200 0.150 0.200 0.561 −1.115
Lev 200 0.293 0.159 0.705 0.048
DN 200 7.635 1.323 9.000 0.000
Abbreviations: COORP, Industry-university-research cooperation;
DN, Board size;
ENVIR, Environmental protection investment intensity; ES, Enterprise scale;
GIE, Green innovation efficiency; GOVNM, Government financial support;
Lev, Asset-liability ratio;
LHD, Ownership concentration; Profit, Net operating cash flow;
RD, research and development investment.
Table 6. Pearson’s correlation coefficient of all variables involved in this study
Variables GIE RD ES COORP ENVIR GOVNM LHD Profit Lev DN
GIE 1
RD 0.153** 1
ES −0.133 ∗∗ 0.659** 1
COORP 0.043 0.300** 0.342** 1
ENVIR 0.182** 0.130 0.265** −0.051 1
GOVNM 0.324** 0.222** 0.040 −0.092 0.068 1
LHD −0.117 −0.308 ∗∗ −0.269 ∗∗ −0.220 ∗∗ −0.060 0.030 1
Profit −0.188 ∗ −0.076 −0.173 ∗ −0.204 ∗∗ 0.044 0.240** 0.232** 1
Lev −0.049 0.252* 0.301** 0.150* 0.064 −0.231 ∗∗ −0.046 −0.325 ∗∗ 1
DN 0.127** 0.136 0.161* 0.039 0.194** 0.016 −0.117 −0.206 ∗∗ 0.075 1
Abbreviations: COORP, Industry-university-research cooperation; DN, Board size;
ENVIR, Environmental protection investment intensity;
ES, Enterprise scale; GIE, Green innovation efficiency;
GOVNM, Government financial support; Lev, Asset-liability ratio;
LHD, Ownership concentration; Profit, Net operating cash flow;
RD, Research and development investment.
**At level 0.01 (two-tailed), the correlation was significant; *At level 0.05 (two-tailed), the correlation was significant.
the resilience of innovation entities. During the innovative elements from high to low, thereby
innovation and R&D phase, the comparative ad- achieving the optimal allocation of innovative re-
vantage of innovation resources is obtained. The sources and enhancing corporate innovation rates.
establishment of SNEs attracts R&D capital that Therefore, the following hypothesis is proposed:
flows toward these companies, facilitating close
cooperation, resource complementarity, and infor- H1: R&D investment is significantly and posi-
mation sharing among innovation entities, which tively related to the GIE of SNEs.
promote regional green innovation division of la-
bor and collaboration, ultimately improving the
efficiency of green R&D and achievement transfor- 3.4.2. Enterprise size
mation. The outflow of R&D capital follows the
principle of maximizing profits by reconfiguring Large companies, with advantages such as
economies of scale and access to financing, tend to
and optimizing idle resources within enterprises,
be more innovative. However, as the scale of en-
thus avoiding resource waste and misallocation is-
terprises expands, energy consumption and pollu-
sues. Under the guidance of relevant policies, the
tion also increase, which can offset the economies
upgrading of China’s industrial structure takes
of scale and reduce the GIE. As most SNEs are
the initiative to dock the construction of SNEs,
SMEs, they are sensitive to changes in market de-
prompting the flow of R&D capital and other
mand, making it easy for them to specialize in a
696