
Page 153 - IJOCTA-15-4
P. 153
Green innovation efficiency measurement and its influencing factors in specialized and new enterprises
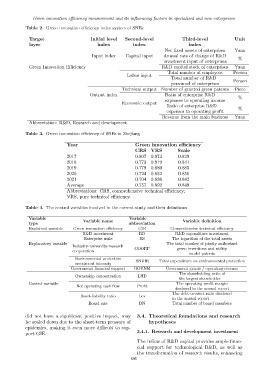
Table 2. Green innovation efficiency index system of SNEs
Target Initial level Second-level Third-level Unit
layer index index index
Net fixed assets of enterprises Yuan
Input index Capital input Annual rate of change of R&D
%
investment input of enterprises
Green Innovation Efficiency R&D capital stock of enterprises Yuan
Total number of employees Person
Labor input
Total number of R&D
Person
personnel of enterprises
Technical output Number of granted green patents Piece
Output index Ratio of enterprise R&D
%
expenses to operating income
Economic output
Ratio of enterprise R&D
%
expenses to operating profit
Revenue from the main business Yuan
Abbreviation: R&D, Research and development.
Table 3. Green innovation efficiency of SNEs in Zhejiang
Year Green innovation efficiency
CRS VRS Scale
2017 0.807 0.973 0.829
2018 0.773 0.919 0.841
2019 0.779 0.880 0.885
2020 0.724 0.852 0.850
2021 0.704 0.836 0.842
Average 0.757 0.892 0.849
Abbreviations: CRS, comprehensive technical efficiency;
VRS, pure technical efficiency.
Table 4. The control variables involved in the current study and their definitions
Variable Variable name Variable Variable definition
type abbreviation
Explained variable Green innovation efficiency GIE Comprehensive technical efficiency
R&D investment RD R&D expenditure investment
Enterprise scale ES The logarithm of the total assets
Explanatory variable The total number of jointly authorized
Industry-university-research COORP green inventions and utility
cooperation
model patents
Environmental protection
ENVIR Total expenditure on environmental protection
investment intensity
Government financial support GOVNM Government grants / operating revenue
The shareholding ratio of
Ownership concentration LHD
the largest shareholder
Control variable The operating profit margin
Net operating cash flow Profit
disclosed in the annual report
The debt-to-asset ratio disclosed
Asset-liability ratio Lev
in the annual report
Board size DN Total number of board members
did not have a significant positive impact, may 3.4. Theoretical foundations and research
be scaled down due to the short-term pressure of hypotheses
epidemics, making it even more difficult to sup-
3.4.1. Research and development investment
port GIE.
The inflow of R&D capital provides ample finan-
cial support for technological R&D, as well as
the transformation of research results, enhancing
695