
Page 124 - IJPS-1-1
P. 124
Using panel data to examine pregnancy attitudes over time
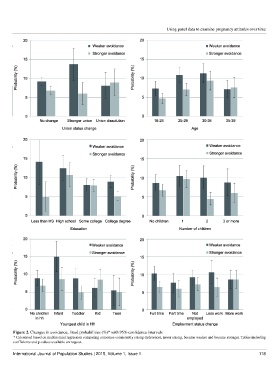
Figure 2. Changes in avoidance, fitted probabilities (%)* with 95% confidence intervals
* Calculated based on multinomial regression comparing outcomes consistently strong (reference), never strong, became weaker and became stronger. Tables including
coefficients and p-values available on request.
International Journal of Population Studies | 2015, Volume 1, Issue 1 118