Page 120 - IJPS-1-1
P. 120

Using panel data to examine pregnancy attitudes over time

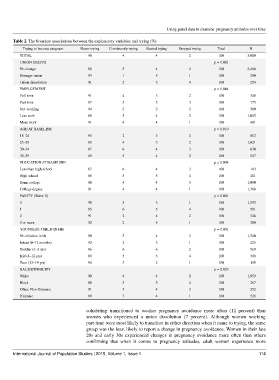
       Table 2. The bivariate associations between the explanatory variables and trying (%)
           Trying to become pregnant   Never trying   Consistently trying   Started trying   Stopped trying   Total   N
          TOTAL                        90            4             4              2           100          3,000
          UNION STATUS                                                                      p = 0.001
          No change                    89            5             4              2           100          2,466
          Stronger union               93            1             5              1           100           280
          Union dissolution            91            2             3              4           100           254
          EMPLOYMENT                                                                        p = 0.044
          Full time                    91            4             3              2           100           348
          Part time                    87            5             5              3           100           775
          Not working                  94            2             2              2           100           380
          Less work                    89            5             4              2           100          1,005
          More work                    91            4             4              1           100           481
          AGE AT BASELINE                                                                   p = 0.010
          18–24                        93            2             3              2           100           802
          25–29                        89            4             5              2           100          1,021
          30–34                        87            6             4              3           100           630
          35–39                        89            5             4              2           100           547
          EDUCATION AT BASELINE                                                             p = 0.004
          Less than high school        87            6             4              3           100           143
          High school                  85            5             5              4           100           401
          Some college                 90            4             4              3           100          1,090
          College degree               91            4             4              1           100          1,366
          PARITY (Wave II)                                                                  p = 0.001
          0                            90            5             3              1           100          1,593
          1                            85            6             5              4           100           581
          2                            91            2             4              2           100           526
          3 or more                    92            2             5              1           100           300
          YOUNGEST CHILD IN HH                                                              p = 0.001
          No children in hh            90            5             4              2           100          1,540
          Infant (0–12 months)         92            2             5              1           100           425
          Toddler (1–3 yrs)            86            6             6              2           100           569
          Kid (4–12 yrs)               89            3             3              4           100           348
          Teen (13–19 yrs)             94            3             2              1           100           118
          RACE/ETHNICITY                                                                    p = 0.029
          White                        90            4             4              2           100          1,953
          Black                        88            3             5              4           100           267
          Other, Non-Hispanic          91            3             4              2           100           252
          Hispanic                     89            7             4              1           100           528

                                      cohabiting  transitioned  to  weaker  pregnancy  avoidance  more  often  (12  percent)  than
                                      women  who  experienced  a  union  dissolution  (7  percent).  Although  women  working
                                      part-time were most likely to transition in either direction when it came to trying, the same
                                      group was the least likely to report a change in pregnancy avoidance. Women in their late
                                      20s and early  30s experienced changes  in pregnancy  avoidance  more often than others
                                      confirming  that  when  it  comes  to  pregnancy  attitudes,  adult  women  experience more

       International Journal of Population Studies | 2015, Volume 1, Issue 1                                    114
   115   116   117   118   119   120   121   122   123   124   125