Page 121 - IJPS-1-1
P. 121

Heini Väisänen and Rachel K. Jones

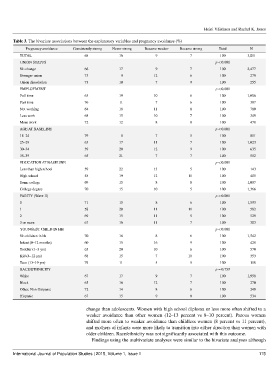
       Table 3. The bivariate associations between the explanatory variables and pregnancy avoidance (%)
            Pregnancy avoidance   Consistently strong   Never strong   Became weaker   Became strong   Total   N
          TOTAL                      68             16             9              7            100         3,011
          UNION STATUS                                                                       p < 0.001
          No change                  66             17             9              7            100         2,477
          Stronger union             73              9             12             6            100          279
          Union dissolution          73             10             7              9            100          255
          EMPLOYMENT                                                                         p < 0.001
          Full time                  65             19             10             6            100         1,006
          Part time                  76             11             7              6            100          387
          Not working                64             18             11             8            100          780
          Less work                  68             15             10             7            100          349
          More work                  72             12             8              8            100          478
          AGE AT BASELINE                                                                    p < 0.001
          18–24                      79              8             7              5            100          801
          25–29                      65             17             11             7            100         1,023
          30–34                      59             20             12             9            100          635
          35–39                      65             21             7              7            100          552
          EDUCATION AT BASELINE                                                              p < 0.001
          Less than high school      59             22             13             5            100          143
          High school                58             19             12            11            100          405
          Some college               69             15             8              8            100         1,097
          College degree             70             15             10             5            100         1,366
          PARITY (Wave II)                                                                   p < 0.001
          0                          71             15             8              6            100         1,593
          1                          58             20             11            11            100          582
          2                          69             15             11             5            100          529
          3 or more                  67             16             11             7            100          303
          YOUNGEST CHILD IN HH                                                               p < 0.001
          No children in hh          70             16             8              6            100         1,542
          Infant (0–12 months)       60             15             16             9            100          428
          Toddler (1–3 yrs)          65             20             10             6            100          570
          Kid (4–12 yrs)             68             15             7             10            100          353
          Teen (13–19 yrs)           79             11             5              5            100          118
          RACE/ETHNICITY                                                                     p = 0.759
          White                      67             17             9              7            100         1,958
          Black                      65             16             12             7            100          270
          Other, Non-Hispanic        72             14             8              6            100          249
          Hispanic                   67             15             9              8            100          534

                                      change than adolescents. Women with high school diploma or less more often shifted to a
                                      weaker avoidance than other  women (12–13 percent vs 8–10 percent). Parous  women
                                      shifted more often to weaker avoidance than childless women (8 percent vs 11 percent),
                                      and mothers of infants were more likely to transition into either direction than women with
                                      older children. Race/ethnicity was not significantly associated with this outcome.
                                        Findings using the multivariate analyses were similar to the bivariate analyses although


       International Journal of Population Studies | 2015, Volume 1, Issue 1                                    115
   116   117   118   119   120   121   122   123   124   125   126