Page 119 - IJPS-1-1
P. 119

Heini Väisänen and Rachel K. Jones

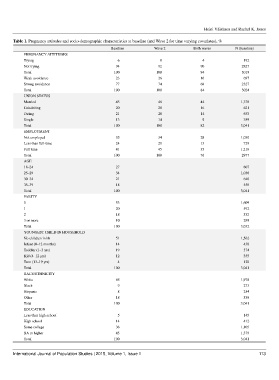
       Table 1. Pregnancy attitudes and socio-demographic characteristics at baseline (and Wave 2 for time varying covariates), %
                                                Baseline           Wave 2           Both waves       N (baseline)

           PREGNANCY ATTITUDES
           Trying                                  6                 8                 4                 192
           Not trying                             94                 92                90               2827
           Total                                  100               100                94               3019
           Weak avoidance                         23                 26                16                697
           Strong avoidance                       77                 74                68               2327
           Total                                  100               100                84               3024
           UNION STATUS
           Married                                45                 46                44               1,378
           Cohabiting                             20                 20                16                621
           Dating                                 21                 20                14                653
           Single                                 13                 14                9                 389
           Total                                  100               100                82               3,041
           EMPLOYMENT
           Not employed                           35                 34                28               1,030
           Less than full-time                    24                 21                13                729
           Full time                              41                 45                35               1,218
           Total                                  100               100                76               2977
           AGE
           18–24                                  27                                                     807
           25–29                                  34                                                    1,036
           30–34                                  21                                                     640
           35–39                                  18                                                     558
           Total                                  100                                                   3,041
           PARITY
           0                                      53                                                    1,609
           1                                      20                                                     592
           2                                      18                                                     532
           3 or more                              10                                                     299
           Total                                  100                                                   3,032
           YOUNGEST CHILD IN HOUSEHOLD
           No children in hh                      51                                                    1,562
           Infant (0–12 months)                   14                                                     430
           Toddler (1–3 yrs)                      19                                                     574
           Kid (4–12 yrs)                         12                                                     355
           Teen (13–19 yrs)                        4                                                     120
           Total                                  100                                                   3,041
           RACE/ETHNICITY
           White                                  65                                                    1,978
           Black                                   9                                                     273
           Hispanic                                8                                                     254
           Other                                  18                                                     536
           Total                                  100                                                   3,041
           EDUCATION
           Less than high school                   5                                                     145
           High school                            14                                                     412
           Some college                           36                                                    1,105
           BA or higher                           45                                                    1,379
           Total                                  100                                                   3,041


       International Journal of Population Studies | 2015, Volume 1, Issue 1                                    113
   114   115   116   117   118   119   120   121   122   123   124