
Page 58 - IJPS-1-1
P. 58
Earlier and more rapid ageing: Does nutrition contribute?
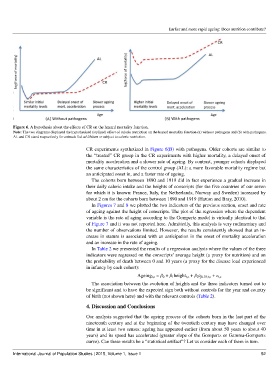
Figure 6. A hypothesis about the effects of CR on the hazard mortality function.
Note: The two diagrams displayed the hypothesized (stylized) effect of calorie restriction on the hazard mortality function (a) without pathogens and (b) with pathogens.
AL and CR stand respectively for animals fed ad libitum or subject to caloric restriction.
CR experiments synthetized in Figure 6(B) with pathogens. Older cohorts are similar to
the “treated” CR group in the CR experiments with higher mortality, a delayed onset of
mortality acceleration and a slower rate of ageing. By contrast, younger cohorts displayed
the same characteristics of the control group (AL): a more favorable mortality regime but
an anticipated onset in, and a faster rate of ageing.
The cohorts born between 1890 and 1919 did in fact experience a gradual increase in
their daily caloric intake and the heights of conscripts (for the five countries of our seven
for which it is known: France, Italy, the Netherlands, Norway and Sweden) increased by
about 2 cm for the cohorts born between 1890 and 1919 (Hatton and Bray, 2010).
In Figures 7 and 8 we plotted the two indicators of the previous section, onset and rate
of ageing against the height of conscripts. The plot of the regression where the dependent
variable is the rate of aging according to the Gompertz model is virtually identical to that
of Figure 7 and it was not reported here. Admittedly, this analysis is very rudimentary and
the number of observations limited. However, the results consistently showed that an in-
crease in stature is associated with an anticipation in the onset of mortality acceleration
and an increase in the rate of ageing.
In Table 2 we presented the results of a regression analysis where the values of the three
indicators were regressed on the conscripts’ average height (a proxy for nutrition) and on
the probability of death between 0 and 10 years (a proxy for the disease load experienced
in infancy by each cohort):
Ageing t,c = β 0 + β 1height t,c + β 2q 0-10,t,c + ε t,c
The association between the evolution of heights and the three indicators turned out to
be significant and to have the expected sign both without controls for the year and country
of birth (not shown here) and with the relevant controls (Table 2).
4. Discussion and Conclusions
Our analysis suggested that the ageing process of the cohorts born in the last part of the
nineteenth century and at the beginning of the twentieth century may have changed over
time in at least two senses: ageing has appeared earlier (from about 50 years to about 40
years) and its speed has accelerated (greater slope of the Gompertz or Gamma-Gompertz
curve). Can these results be a “statistical artifact”? Let us consider each of them in turn.
International Journal of Population Studies | 2015, Volume 1, Issue 1 52