
Page 54 - IJPS-1-1
P. 54
Earlier and more rapid ageing: Does nutrition contribute?
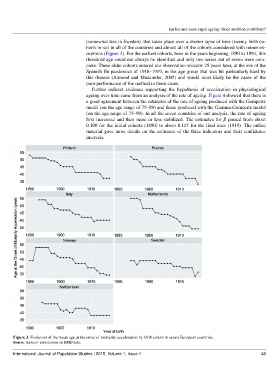
(somewhat less in Sweden), that takes place over a shorter lapse of time (twenty birth co-
horts or so) in all of the countries and almost all of the cohorts considered with minor ex-
ceptions (Figure 3). For the earliest cohorts, born in the years beginning 1890 to 1894, this
threshold age could not always be identified and only two series out of seven were com-
plete. These older cohorts entered our observation window 25 years later, at the eve of the
Spanish flu pandemics of 1918–1919, in the age group that was hit particularly hard by
this disease (Almond and Mazumder, 2005) and would most likely be the cause of the
poor performance of the method in these cases.
Further indirect evidence supporting the hypothesis of acceleration in physiological
ageing over time came from an analysis of the rate of ageing. Figure 4 showed that there is
a good agreement between the estimates of the rate of ageing produced with the Gompertz
model (on the age range of 75–89) and those produced with the Gamma-Gompertz model
(on the age range of 75–99). In all the seven countries of our analysis, the rate of ageing
first increased and then more or less stabilized. The estimates for β passed from about
0.100 for the initial cohorts (1890) to about 0.115 for the final ones (1919). The online
material gave more details on the estimates of the three indicators and their confidence
intervals.
Figure 3. Evolution of the mean age at the onset of mortality acceleration by birth cohort in seven European countries.
Source: Authors’ elaborations on HMD data.
International Journal of Population Studies | 2015, Volume 1, Issue 1 48