
Page 52 - IJPS-1-1
P. 52
Earlier and more rapid ageing: Does nutrition contribute?
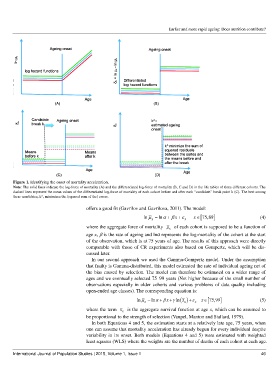
Figure 1. Identifying the onset of mortality acceleration.
Note: The solid lines indicate the log-force of mortality (A) and the differentiated log-force of mortality (B, C and D) in the life tables of three different cohorts. The
dashed lines represent the mean values of the differentiated log-force of mortality of each cohort before and after each “candidate” break point k (C). The best among
these candidates, k^, minimizes the (squared sum of the) errors.
offers a good fit (Gavrilov and Gavrilova, 2011). The model:
]
ln µ lnα = β + x ε + x∈ [75,89 (4)
x x
where the aggregate force of mortality µ of each cohort is supposed to be a function of
x
age x, β is the rate of ageing and lnα represents the log-mortality of the cohort at the start
of the observation, which is at 75 years of age. The results of this approach were directly
comparable with those of CR experiments also based on Gompertz, which will be dis-
cussed later.
In our second approach we used the Gamma-Gompertz model. Under the assumption
that frailty is Gamma-distributed, this model estimated the rate of individual ageing net of
the bias caused by selection. The model can therefore be estimated on a wider range of
ages and we eventually selected 75–99 years (Not higher because of the small number of
observations especially in older cohorts and various problems of data quality including
open-ended age classes). The corresponding equation is:
]
ln µ x lnα = β + x γ + ln s x x x∈ [75,99 (5)
( ) ε +
where the term s is the aggregate survival function at age x, which can be assumed to
x
be proportional to the strength of selection (Vaupel, Manton and Stallard, 1979).
In both Equations 4 and 5, the estimation starts at a relatively late age, 75 years, when
one can assume that mortality acceleration has already begun for every individual despite
variability in its onset. Both models (Equations 4 and 5) were estimated with weighted
least squares (WLS) where the weights are the number of deaths of each cohort at each age.
International Journal of Population Studies | 2015, Volume 1, Issue 1 46