
Page 70 - IJPS-1-1
P. 70
Undocumented migration in response to climate change
to account for the correlation between climate and elevation using a Digital Elevation
Model (DEM) (Danielson and Gesch, 2011) as a covariate in the interpolation model. We
employed a bootstrap resampling procedure to cross-validate the interpolation results and
found the local estimates to be robust. Using a lattice of 700 × 700 m, we then extracted
climate change values from the interpolation surface and assigned the respective area av-
erage to each MMP municipality for which migration histories were available.
Finally, we computed relative change measures as the standardized difference between
the climate index value during the 3-year window leading up to each observational year
and a 30-year (1961–1990) long-term average. A 3-year window was chosen to minimize
the influence of short-term fluctuations and to account for lagged response patterns
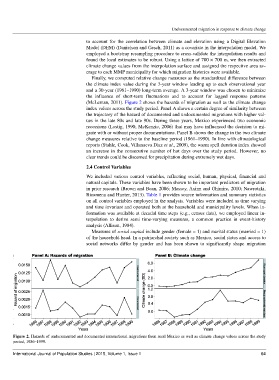
(McLeman, 2011). Figure 2 shows the hazards of migration as well as the climate change
index values across the study period. Panel A shows a certain degree of similarity between
the trajectory of the hazard of documented and undocumented migrations with higher val-
ues in the late 80s and late 90s. During these years, Mexico experienced two economic
recessions (Lustig, 1990; McKenzie, 2006) that may have influenced the decision to mi-
grate with or without proper documentations. Panel B shows the change in the two climate
change measures relative to the baseline period (1961–1990). In line with climatological
reports (Stahle, Cook, Villanueva Diaz et al., 2009), the warm spell duration index showed
an increase in the consecutive number of hot days over the study period. However, no
clear trends could be discerned for precipitation during extremely wet days.
2.4 Control Variables
We included various control variables, reflecting social, human, physical, financial and
natural capitals. These variables have been shown to be important predictors of migration
in prior research (Brown and Bean, 2006; Massey, Axinn and Ghimire, 2010; Nawrotzki,
Riosmena and Hunter, 2013). Table 1 provides source information and summary statistics
on all control variables employed in the analysis. Variables were included as time varying
and time invariant and operated both at the household and municipality levels. When in-
formation was available at decadal time steps (e.g., census data), we employed linear in-
terpolation to derive semi time-varying measures, a common practice in event-history
analysis (Allison, 1984).
Measures of social capital include gender (female = 1) and marital status (married = 1)
of the household head. In a patriarchal society such as Mexico, social status and access to
social networks differ by gender and has been shown to significantly shape migration
Figure 2. Hazards of undocumented and documented international migrations from rural Mexico as well as climate change values across the study
period, 1986–1999.
International Journal of Population Studies | 2015, Volume 1, Issue 1 64