
Page 71 - IJPS-1-1
P. 71
Raphael J. Nawrotzki, Fernando Riosmena, Lori M. Hunter, and Daniel M. Runfola
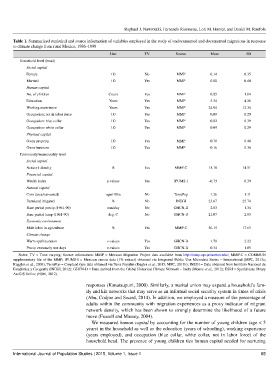
Table 1. Summarized statistical and source information of variables employed in the study of undocumented and documented migrations in response
to climate change from rural Mexico, 1986–1999
Unit TV Source Mean SD
Household level (head)
Social capital
Female 1|0 No MMP 0.14 0.35
Married 1|0 Yes MMP 0.80 0.40
Human capital
No. of children Count Yes MMP 0.85 1.04
Education Years Yes MMP 5.34 4.28
Working experience Years Yes MMP 24.94 12.34
Occupation: not in labor force 1|0 Yes MMP 0.09 0.29
Occupation: blue collar 1|0 Yes MMP 0.82 0.39
Occupation: white collar 1|0 Yes MMP 0.09 0.29
Physical capital
Owns property 1|0 Yes MMP 0.70 0.46
Owns business 1|0 Yes MMP 0.16 0.36
Community/municipality level
Social capital
Network density % Yes MMP-C 15.18 14.51
Financial capital
Wealth index z-values Yes IPUMS-I –0.79 0.39
Natural capital
Corn (area harvested) sqm/10ha No TerraPop 1.26 1.11
Farmland irrigated % No INEGI 23.67 25.74
Base period precip (1961-90) mm/day No GHCN-D 2.83 1.34
Base period temp (1961-90) deg. C No GHCN-D 21.07 2.93
Economic environment
Male labor in agriculture % Yes MMP-C 56.15 17.65
Climate change
Warm spell duration z-values Yes GHCN-D 1.79 2.22
Precip extremely wet days z-values Yes GHCN-D 0.34 1.05
Notes: TV = Time varying; Source information: MMP = Mexican Migration Project data available from http://mmp.opr.princeton.edu/; MMP-C = COMMUN
supplementary file of the MMP; IPUMS-I = Mexican census data (1% extract) obtained via Integrated Public Use Microdata Series – International (MPC, 2013a;
Ruggles et al., 2003); TerraPop = Cropland type data obtained via Terra Populus (Kugler et al., 2015; MPC, 2013b); INEGI = Data obtained from Instituto Nacional de
Estadística y Geografía (INEGI, 2012); GHCN-D = Data derived from the Global Historical Climate Network – Daily (Menne et al., 2012); ESRI = Spatial data library
ArcGIS Online (ESRI, 2012).
responses (Kanaiaupuni, 2000). Similarly, a marital union may expand a household’s fam-
ily and kin networks that may serve as an informal social security system in times of crisis
(Abu, Codjoe and Sward, 2014). In addition, we employed a measure of the percentage of
adults within the community with migration experiences as a proxy indicator of migrant
network density, which has been shown to strongly determine the likelihood of a future
move (Fussell and Massey, 2004).
We measured human capital by accounting for the number of young children (age < 5
years) in the household as well as the education (years of schooling), working experience
(years employed), and occupation (blue collar, white collar, not in labor force) of the
household head. The presence of young children ties human capital needed for nurturing
International Journal of Population Studies | 2015, Volume 1, Issue 1 65