
Page 12 - IJPS-10-3
P. 12
International Journal of
Population Studies The use of multiregional life tables in Italy
A B
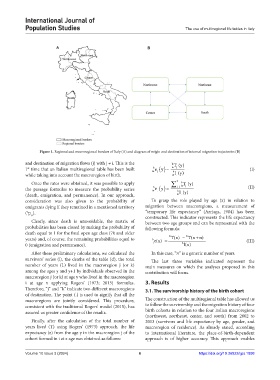
Figure 1. Regional and macroregional borders of Italy (A) and diagram of origin and destination of internal migration trajectories (B)
and destination of migration flows (j) with j ≠ i. This is the b T (y)
( ) =
1 time that an Italian multiregional table has been built ix b ey ix j (I)
st
j
b
while taking into account the macroregion of birth. ix . l (y)
Once the rates were obtained, it was possible to apply 3 b T (y)
= ix j
b
ey
the passage formulas to measure the probability series ix . ( ) = ∑ j1 (II)
b
(death, emigration, and permanence). In our approach, ix . l (y)
consideration was also given to the probability of To grasp the role played by age (x) in relation to
emigrants dying if they remained in a mentioned territory migration between macroregions, a measurement of
( p ). “temporary life expectancy” (Arriaga, 1984) has been
b
i,i
Clearly, since death is unavoidable, the matrix of constructed. This indicator represents the life expectancy
between two age groups and can be represented with the
probabilities has been closed by making the probability of following formula:
death equal to 1 for the final open age class (70 and older
years) and, of course, the remaining probabilities equal to b e(x) = b −T(x) b + T(x n) (III)
0 (emigration and permanence). i b l( )x
After these preliminary calculations, we calculated the In this case, “n” is a generic number of years.
survivors’ series (l), the deaths of the table (d), the total The last three variables indicated represent the
number of years (L) lived in the macroregion j (or k) main measures on which the analyses proposed in this
among the ages y and y+1 by individuals observed in the contribution will focus.
macroregion j (or k) at age y who lived in the macroregion
i at age x applying Rogers’ (1973; 2015) formulas. 3. Results
Therefore, “j” and “k” indicate two different macroregions 3.1. The survivorship history of the birth cohort
of destination. The point (.) is used to signify that all the
macroregions are jointly considered. This procedure, The construction of the multiregional table has allowed us
consistent with the traditional Rogers’ model (2015), has to follow the survivorship and the migration history of four
assured us greater confidence of the results. birth cohorts in relation to the four Italian macroregions
(northwest, northeast, center, and south) from 2002 to
Finally, after the calculation of the total number of 2013 (survivors and life expectancy by age, gender, and
years lived (T) using Rogers’ (1973) approach, the life macroregion of residence). As already stated, according
expectancy (e) from the age y in the macroregion j of the to international literature, the place-of-birth-dependent
cohort formed in i at x age was obtained as follows: approach is of higher accuracy. This approach enables
Volume 10 Issue 3 (2024) 6 https://doi.org/10.36922/ijps.1898