
Page 14 - IJPS-10-3
P. 14
International Journal of
Population Studies The use of multiregional life tables in Italy
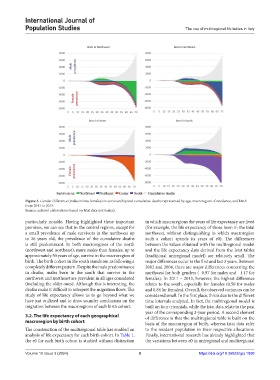
Figure 3. Gender difference (males minus females) in survivorship and cumulative deaths represented by age, macroregion of residence, and birth
from 2011 to 2013.
Source: authors’ elaborations based on Istat data (estimates).
particularly notable. Having highlighted these important in which macroregions the years of life expectancy are lived
premises, we can see that in the central regions, except for (for example, the life expectancy of those born in the total
a small prevalence of male survivors in the northwest up northwest, without distinguishing in which macroregion
to 26 years old, the prevalence of the cumulative deaths such a cohort spends its years of e0). The differences
is still predominant. In both macroregions of the north between the values obtained with the multiregional model
(northwest and northeast), more males than females, up to and the life expectancy data derived from the Istat tables
approximately 50 years of age, survive in the macroregion of (traditional uniregional model) are relatively small. The
birth. The birth cohort in the south stands out as following a major differences occur in the first and last 3 years. Between
completely different pattern. Despite the male predominance 2002 and 2004, there are major differences concerning the
in deaths, males born in the south that survive in the northwest for both genders (−0.97 for males and −1.17 for
northwest and northeast are prevalent in all ages considered females). In 2011 – 2013, however, the highest difference
(including the older ones). Although this is interesting, the relates to the south, especially for females (0.50 for males
deaths make it difficult to interpret the migration flows. The and 0.84 for females). Overall, the observed variances can be
study of life expectancy allows us to go beyond what we considered small. In the first place, this is due to the different
have just outlined and to draw sounder conclusions on the time intervals analyzed. In fact, the multiregional model is
migration between the macroregions of each birth cohort. built on four triennials, while the Istat data relate to the past
year of the corresponding 3-year period. A second element
3.2. The life expectancy of each geographical of difference is that the multiregional table is built on the
macroregion by birth cohort basis of the macroregion of birth, whereas Istat data refer
The construction of the multiregional table has enabled an to the resident population in their respective allocations.
analysis of life expectancy for each birth cohort. In Table 1, Finally, international research has already highlighted that
the e0 for each birth cohort is studied without distinction the variations between e0 in uniregional and multiregional
Volume 10 Issue 3 (2024) 8 https://doi.org/10.36922/ijps.1898