
Page 16 - IJPS-10-3
P. 16
International Journal of
Population Studies The use of multiregional life tables in Italy
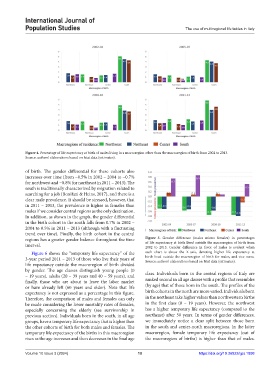
Figure 4. Percentage of life expectancy at birth of males living in a macroregion other than the macroregion of birth from 2002 to 2013.
Source: authors’ elaborations based on Istat data (estimates).
of birth. The gender differential for these cohorts also
increases over time (from −0.5% in 2002 – 2004 to −0.7%
for northwest and −0.8% for northeast in 2011 – 2013). The
south is traditionally characterized by migration related to
searching for a job (Bonifazi & Heins, 2017), and there is a
clear male prevalence. It should be stressed, however, that
in 2011 – 2013, the prevalence is higher in females than
males if we consider central regions as the only destination.
In addition, as shown in the graph, the gender differential
in the birth cohort in the south falls from 0.7% in 2002 –
2004 to 0.5% in 2011 – 2013 (although with a fluctuating
trend over time). Finally, the birth cohort in the central
regions has a greater gender balance throughout the time Figure 5. Gender difference (males minus females) in percentages
interval. of life expectancy at birth lived outside the macroregion of birth from
2002 to 2013. Gender difference in favor of males is evident when
Figure 6 shows the “temporary life expectancy” of the each chart is above the X-axis, denoting higher life expectancy at
3-year period 2011 – 2013 of those who live their years of birth lived outside the macroregion of birth for males, and vice versa.
Source: authors’ elaborations based on Istat data (estimates).
life expectancy outside the macroregion of birth divided
by gender. The age classes distinguish young people (0 class. Individuals born in the central regions of Italy are
– 19 years), adults (20 – 39 years and 40 – 59 years), and
finally, those who are about to leave the labor market ranked second in all age classes with a profile that resembles
or have already left (60 years and older). Note that life (by age) that of those born in the south. The profiles of the
expectancy is not expressed as a percentage in this figure. birth cohorts in the north are more varied. Individuals born
Therefore, the comparison of males and females can only in the northeast take higher values than northwestern births
be made considering the lower mortality rates of females, in the first class (0 – 19 years). However, the northwest
especially concerning the elderly (see survivorship in has a higher temporary life expectancy (compared to the
previous section). Individuals born in the south, in all age northeast) after 50 years. In terms of gender differences,
groups, have a temporary life expectancy that is higher than we immediately notice a clear split between those born
the other cohorts of birth for both males and females. The in the south and center-north macroregions. In the latter
temporary life expectancy of the births in this macroregion macroregion, female temporary life expectancy (out of
rises as the age increases and then decreases in the final age the macroregion of births) is higher than that of males.
Volume 10 Issue 3 (2024) 10 https://doi.org/10.36922/ijps.1898