
Page 17 - IJPS-10-3
P. 17
International Journal of
Population Studies The use of multiregional life tables in Italy
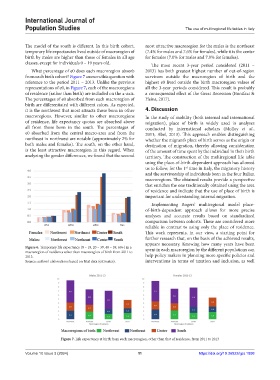
The model of the south is different. In this birth cohort, most attractive macroregion for the males is the northeast
temporary life expectancies lived outside of macroregion of (7.4% for males and 7.6% for females), while it is the center
birth by males are higher than those of females in all age for females (7.0% for males and 7.9% for females).
classes, except for individuals 0 – 19 years old. The most recent 3-year period considered (2011 –
What percentage of e0 does each macroregion absorb 2013) has both greatest highest number of out-of-region
from each birth cohort? Figure 7 answers this question with survivors outside the macroregion of birth and the
reference to the period 2011 – 2013. Unlike the previous highest e0 lived outside the birth macroregion values of
representations of e0, in Figure 7, each of the macroregions all the 3-year periods considered. This result is probably
of residence (rather than birth) are included on the x-axis. a consequential effect of the Great Recession (Bonifazi &
The percentages of e0 absorbed from each macroregion of Heins, 2017).
birth are differentiated with different colors. As expected,
it is the northwest that most attracts those born in other 4. Discussion
macroregions. However, similar to other macroregions In the study of mobility (both internal and international
of residence, life expectancy quotas are absorbed above migration), place of birth is widely used in analyses
all from those born in the south. The percentages of conducted by international scholars (Molloy et al.,
e0 absorbed from the central macro-area and from the 2011; Abel, 2013). This approach enables distinguishing
northeast in northwest are notable (approximately 2% for whether the migrant’s place of birth serves as the origin or
both males and females). The south, on the other hand, destination of migration, thereby allowing consideration
is the least attractive macroregion in this regard. When of the amount of time spent by the individual in their birth
analyzing the gender differences, we found that the second territory. The construction of the multiregional life table
using the place-of-birth-dependent approach has allowed
us to follow, for the 1 time in Italy, the migratory history
st
and the survivorship of individuals born in the four Italian
macroregions. The obtained results provide a perspective
that enriches the one traditionally obtained using the area
of residence and indicate that the use of place of birth is
important for understanding internal migration.
Implementing Rogers’ multiregional model place-
of-birth-dependent approach allows for more precise
analyses and accurate results based on standardized
comparison between cohorts. These are considered more
reliable in contrast to using only the place of residence.
This work represents, in our view, a starting point for
further research that, on the basis of the achieved results,
appears necessary. Knowing how many years have been
Figure 6. Temporary life expectancy (0 – 19, 20 – 39, 40 – 59, 60+) in a spent in each macroregion by the different populations can
macroregion of residence other than macroregion of birth from 2011 to
2013. help policy makers in planning more specific policies and
Source: authors’ elaborations based on Istat data (estimates). interventions in terms of taxation and inclusion, as well
Figure 7. Life expectancy at birth from each macroregion, other than that of residence, from 2011 to 2013
Volume 10 Issue 3 (2024) 11 https://doi.org/10.36922/ijps.1898