
Page 15 - IJPS-10-3
P. 15
International Journal of
Population Studies The use of multiregional life tables in Italy
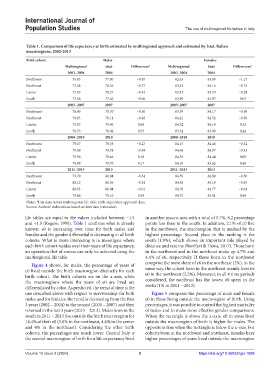
Table 1. Comparison of life expectancy at birth estimated by multiregional approach and estimated by Istat. Italian
macroregions, 2002-2013
Birth cohort Males Females
Multiregional Istat Differences* Multiregional Istat Differences*
2002–2004 2004 2002–2004 2004
Northwest 76.83 77.80 −0.97 82.63 83.80 −1.17
Northeast 77.48 78.26 −0.77 83.42 84.16 −0.74
Center 77.95 78.27 −0.32 83.42 83.70 −0.28
South 77.56 77.62 −0.06 82,99 82.97 0.03
2005–2007 2007 2005–2007 2007
Northwest 78.40 78.70 −0.30 83.59 84.17 −0.59
Northeast 78.83 79.11 −0.28 84.21 84.52 −0.30
Center 79.05 78.96 0.08 84.52 84.19 0.32
South 78.55 78.02 0.53 83.32 83.09 0.24
2008–2010 2010 2008–2010 2010
Northwest 79.07 79.35 −0.27 84.15 84.48 −0.32
Northeast 79.40 79.78 −0.38 84.64 84.97 −0.33
Center 79.56 79.46 0.10 84.53 84.44 0.09
South 78.88 78.70 0.17 84.10 83.62 0.48
2011–2013 2013 2011–2013 2013
Northwest 79.70 80.04 −0.34 84.59 84.89 −0.30
Northeast 80.12 80.36 −0.24 84.83 85.19 −0.35
Center 80.03 80.04 −0.01 84.76 84.77 −0.01
South 79.66 79.16 0.50 84.75 83.91 0.84
Notes: *Istat data minus multiregional life table birth-dependent approach data.
Source: Authors’ elaborations based on Istat data (estimates).
life tables are equal to the values included between −1.5 in another macro-area with a total of 5.7%, 8.2 percentage
and +1.5 (Rogers, 1995). Table 1 confirms what is already points less than in the south. In addition, 2.1% of e0 live
known: e0 is increasing over time for both males and in the northwest, the macroregion that is marked by the
females and the gender differential is decreasing in all birth highest percentage. Second place in the ranking is the
cohorts. What is more interesting is to investigate where south (1.9%), which shows an important role played by
each birth cohort resides over their years of life expectancy, distance and returns (Bonifazi & Heins, 2017). Those born
an operation that of course can only be achieved using the in the northwest and in the northeast make up 4.7% and
multiregional life table. 4.4% of e0, respectively. If those born in the northwest
Figure 4 shows, for males, the percentage of years of comprise the main share of e0 in the northeast (2%), in the
e0 lived outside the birth macroregion distinctly for each same way, the cohort born in the northeast mainly lives its
birth cohort. The birth cohorts are on the x-axis, while e0 in the northwest (2.2%). Moreover, in all 4 time periods
the macroregions where the years of e0 are lived are considered, the northeast has the lowest e0 spent in the
differentiated by color. As predicted, the trend of time is the south (1% in 2011 – 2013).
one described above with respect to survivorship: for both Figure 5 compares the percentage of male and female
males and for females, the trend is decreasing from the first e0 in those living outside the macroregion of birth. Using
3 years (2002 – 2004) to the second (2005 – 2007) and then percentages, it was possible to control the highest mortality
reversed in the last 3 years (2011 – 2013). Males born in the of males and to make more effective gender comparisons.
south in 2011 – 2013 live outside the birth macroregion for When the rectangle is above the x-axis, e0 in areas lived
14.4% of their e0 (5.8% in the northwest, 4.6% in the center outside the macroregion of birth is higher for males. The
and 4% in the northeast). Considering the other birth opposite is true when the rectangle is below the x-axis. For
cohorts, the percentages are much lower. Central Italy is cohorts born in the northwest and northeast, females have
the second macroregion of birth for a life expectancy lived higher percentages of years lived outside the macroregion
Volume 10 Issue 3 (2024) 9 https://doi.org/10.36922/ijps.1898