
Page 90 - IJPS-11-1
P. 90
International Journal of
Population Studies Cultural values and workplace gender equity
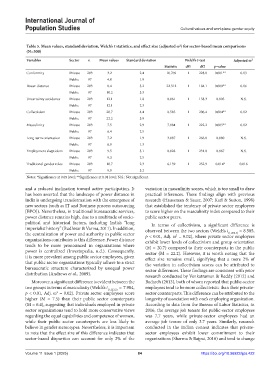
Table 5. Mean values, standard deviation, Welch’s t statistics, and effect size (adjusted ω ) for sector‑based mean comparisons
2
(N=300)
Variables Sector n Mean values Standard deviation Welch’s t‑test Adjusted ω 2
Statistic df1 df2 p‑value
Conformity Private 203 3.2 2.4 10.769 1 228.8 0.001** 0.03
Public 97 4.0 1.9
Power distance Private 203 8.4 3.2 22.312 1 184.1 0.000** 0.06
Public 97 10.2 3.3
Uncertainty avoidance Private 203 12.1 1.8 0.061 1 158.3 0.805 N.S.
Public 97 12.1 2.3
Collectivism Private 203 20.7 4.4 8.585 1 206.4 0.004** 0.02
Public 97 22.2 3.9
Masculinity Private 203 7.5 2.9 7.984 1 222.2 0.005** 0.02
Public 97 6.4 2.5
Long-term orientation Private 203 7.2 1.9 3.087 1 266.8 0.080 N.S.
Public 97 6.9 1.3
Employment skepticism Private 203 9.5 3.1 0.028 1 231.0 0.867 N.S.
Public 97 9.3 2.5
Traditional gender roles Private 203 10.7 2.3 6.159 1 252.9 0.014* 0.016
Public 97 9.9 3.2
Notes: *Significance at 0.05 level; **Significance at 0.01 level; N.S.: Not significant.
and a reduced inclination toward active participation. It variation in masculinity scores, which is too small to draw
has been asserted that the landscape of power distance in practical inferences. These findings align with previous
India is undergoing transformation with the emergence of research (Haussman & Sauer, 2007; Karl & Sutton, 1998)
new sectors (such as IT and Business process outsourcing that established the tendency of private sector employees
[BPO]). Nevertheless, in traditional bureaucratic services, to score higher on the masculinity index compared to their
power distance remains high, due to a multitude of socio- public sector peers.
political and historical factors, including India’s “long In terms of collectivism, a significant difference is
imperialist history” (Budhwar & Varma, 2011). In addition, observed between the two sectors (Welch’s t = 8.585,
the centralization of power and authority in public sector p < 0.01, Adj. ω = 0.02), where private sector employees
(1,206.4)
2
organizations contributes to this difference. Power distance exhibit lower levels of collectivism and group orientation
tends to be more pronounced in organizations where (M = 20.7) compared to their counterparts in the public
power is centralized (Investopedia, n.d.). Consequently, sector (M = 22.2). However, it is worth noting that the
it is more prevalent among public sector employees, given effect size remains small, signifying that a mere 2% of
that public sector organizations typically adhere to a strict the variation in collectivism scores can be attributed to
bureaucratic structure characterized by unequal power sector differences. These findings are consistent with prior
distribution (Andrews et al., 2009). research conducted by Venkatraman & Reddy (2012) and
Moreover, a significant difference is evident between the Badarch (2013), both of whom reported that public-sector
two groups in terms of masculinity (Welch’s t (1,222.2) = 7.984, employees tend to be more collectivistic than their private-
p < 0.01, Adj. ω = 0.02). Private sector employees score sector counterparts. This difference can be attributed to the
2
higher (M = 7.5) than their public sector counterparts longevity of association with one’s employing organization.
(M = 6.4), suggesting that individuals employed in private According to data from the Bureau of Labor Statistics, in
sector organizations tend to hold more conservative views 2016, the average job tenure for public-sector employees
regarding the equal capabilities and competence of women, was 7.7 years, while private-sector employees had an
while their public sector counterparts are less likely to average job tenure of only 3.7 years. Similarly, research
believe in gender stereotypes. Nevertheless, it is important conducted in the Indian context indicates that private-
to note that the effect size of this difference indicates that sector employees exhibit lower commitment to their
sector-based disparities can account for only 2% of the organizations (Sharma & Bajpai, 2010) and tend to change
Volume 11 Issue 1 (2025) 84 https://doi.org/10.36922/ijps.422