
Page 88 - IJPS-11-1
P. 88
International Journal of
Population Studies Cultural values and workplace gender equity
With reference to conformity, the three generational skepticism (Welch’s F (2,82.6) = 6.085, p < 0.01, Adj. ω = 0.03).
2
cohorts in this study exhibited significant differences Gen Yers (M = 9.7) are most skeptical about women’s
(Welch’s F (2,82.8) = 0.252, p < 0.01, Adj. ω = 0.02). Mean values participation in the workplace, while Traditionals are the
2
reveal that Gen Xers (M = 3.9) scored highest on conformity least skeptical (M = 8.5). Post-hoc comparisons revealed
tendency, followed by Gen Y employees (M = 3.4), while that Gen Y has outscored both Traditionals (Mean
Traditionals surprisingly scored the lowest (M = 2.6) on difference = 1.2, p < 0.01) and Gen Xers (Mean difference =
this construct. The effect size, however, is small, indicating 1.1, p < 0.01) in this dimension. Nonetheless, the practical
that merely 2% of variations in conformity scores can be significance of this difference is relatively small, as only
attributed to generational differences. In addition, post hoc 3% of score variations can be attributed to generational
comparisons (Table 3) indicate a statistically significant differences. In contrast, when it comes to the preference
difference between Traditionals and Gen Xers in terms of for traditional gender roles, there are no generational
conformity tendency (Mean difference = 1.37, p < 0.01). differences (Welch’s F (2,86.7) = 0.031, N.S.). The framing effect
These results correspond with the observed might explain the presence of generational differences in
generational differences in collectivism. It is empirically only one dimension of gender equity.
established that collectivism is positively associated with These findings are inconsistent with previous research
the tendency of conformity (Triandis, 1994). Therefore, findings by Parry (2014), who proposed that Gen Y is
it is evident that Traditionals exhibit the least conformity, characterized by a more gender-egalitarian approach
as they scored the lowest on collectivism, while Gen Xers, compared to the previous generations. This inconsistency
who scored the highest on collectivism, are the most can be explained by Millennials’ straightforward and highly
conforming generation. Furthermore, the lower preference vocal attitude (Parment, 2011). Therefore, the findings
for conformity among Gen Y can be supported by previous partially support H2, which states that “There would be
research by Tolbize (2008) and Pettigrew (2014), who have significant differences between Traditionals, Gen X, and
described this generation as non-conforming. Gen Y employees on the dimensions of cultural values,
Regarding generational differences in gender inequity, conformity tendency, and WGE.”
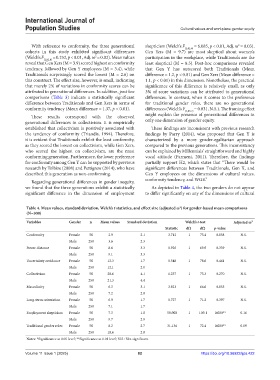
we found that the three generations exhibit a statistically As depicted in Table 4, the two genders do not appear
significant difference in the dimension of employment to differ significantly on any of the dimensions of cultural
Table 4. Mean values, standard deviation, Welch’s t statistics, and effect size (adjusted ω ) for gender‑based mean comparisons
2
(N=300)
Variables Gender n Mean values Standard deviation Welch’s t‑test Adjusted ω 2
Statistic df1 df2 p‑value
Conformity Female 50 2.9 2.1 3.712 1 73.4 0.058 N.S.
Male 250 3.6 2.3
Power distance Female 50 8.6 3.3 0.926 1 69.9 0.339 N.S.
Male 250 9.1 3.3
Uncertainty avoidance Female 50 12.3 1.7 0.548 1 78.6 0.461 N.S.
Male 250 12.1 2.0
Collectivism Female 50 20.6 4.1 1.237 1 73.3 0.270 N.S.
Male 250 21.3 4.4
Masculinity Female 50 6.3 3.1 3.823 1 66.6 0.055 N.S.
Male 250 7.2 2.8
Long-term orientation Female 50 6.9 1.7 0.727 1 71.2 0.397 N.S.
Male 250 7.1 1.7
Employment skepticism Female 50 7.3 1.8 58.900 1 109.1 0.000** 0.16
Male 250 9.7 2.9
Traditional gender roles Female 50 8.2 2.7 31.136 1 72.4 0.000** 0.09
Male 250 10.6 2.8
Notes: *Significance at 0.05 level; **Significance at 0.01 level; N.S.: Not significant.
Volume 11 Issue 1 (2025) 82 https://doi.org/10.36922/ijps.422