
Page 84 - IJPS-11-1
P. 84
International Journal of
Population Studies Cultural values and workplace gender equity
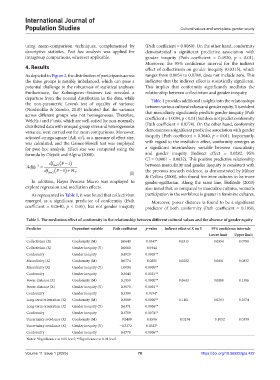
using mean-comparison techniques, complemented by (Path coefficient = 0.0060). On the other hand, conformity
descriptive statistics. Post hoc analysis was applied for demonstrated a significant predictive association with
intragroup comparisons, wherever applicable. gender inequity (Path coefficient = 0.4920, p < 0.01).
Moreover, the 95% confidence interval for the indirect
4. Results effect of collectivism on gender inequity (0.0315), which
As depicted in Figure 2, the distribution of participants across ranges from 0.0054 to 0.0788, does not include zero. This
the three groups is notably imbalanced, which can pose a indicates that the indirect effect is statistically significant.
potential challenge to the robustness of statistical analyses. This implies that conformity significantly mediates the
Furthermore, the Kolmogorov–Smirnov test revealed a relationship between collectivism and gender inequity.
departure from the normal distribution in the data, while Table 1 provides additional insights into the relationships
the non-parametric Leven’s test of equality of variance between various cultural values and gender equity. It is evident
(Nordstokke & Zumbo, 2010) indicated that the variance that masculinity significantly predicts gender inequity (Path
across different groups was not homogeneous. Therefore,
Welch’s t and F tests, which are well-suited for non-normally coefficient = 1.0094, p < 0.01) but does not predict conformity
distributed data with unequal group sizes and heterogeneous (Path coefficient = 0.0774). On the other hand, conformity
variance, were carried out for mean comparisons. Moreover, demonstrates a significant predictive association with gender
adjusted omega square (Adj. ω ), as a measure of effect size, inequity (Path coefficient = 0.3640, p < 0.01). Importantly,
2
was calculated, and the Games-Howell test was employed with regard to the mediation effect, conformity emerges as
for post-hoc analysis. Effect size was computed using the a significant intermediary variable between masculinity
formula by Olejnik and Algina (2000): and gender inequity (Indirect effect = 0.0282, 95%
CI = 0.0001 – 0.0832). This positive predictive relationship
df ( −1F )
Adj . ù 2 = (bet ) between masculinity and gender inequity is consistent with
df (bet ) ( − F ) +1 N T (I) the previous research evidence, as demonstrated by Milner
& Collins (2000), who found feminine cultures to be more
In addition, Hayes Process Macro was employed to gender-egalitarian. Along the same line, Hofstede (2003)
explore regression and mediation effects. also noted that, as compared to masculine cultures, women’s
As represented in Table 1, it was found that collectivism participation in the workforce is greater in feminine cultures.
emerged as a significant predictor of conformity (Path Moreover, power distance is found to be a significant
coefficient = 0.0640, p < 0.05), but not gender inequity predictor of both conformity (Path coefficient = 0.1950,
Table 1. The mediation effect of conformity in the relationship between different cultural values and the absence of gender equity
Predictor Dependent variable Path coefficient p‑value Indirect effect of X on Y 95% confidence intervals
Lower limit Upper limit
Collectivism (X) Conformity (M) 0.0640 0.0347* 0.0315 0.0054 0.0788
Collectivism (X) Gender inequity (Y) 0.0060 0.9344
Conformity Gender inequity 0.4920 0.0005**
Masculinity (X) Conformity (M) 0.0774 0.0885 0.0282 0.0001 0.0832
Masculinity (X) Gender inequity (Y) 1.0094 0.0000**
Conformity Gender inequity 0.3640 0.0021**
Power distance (X) Conformity (M) 0.1950 0.0000** 0.0643 0.0080 0.1386
Power distance (X) Gender inequity (Y) 0.3870 0.0001**
Conformity Gender inequity 0.3300 0.0194*
Long-term orientation (X) Conformity (M) 0.3089 0.0000** 0.1161 0.0263 0.2574
Long-term orientation (X) Gender inequity (Y) 0.6371 0.0006**
Conformity Gender inequity 0.3759 0.0074**
Uncertainty avoidance (X) Conformity (M) −0.0489 0.4596 −0.0234 −0.1052 0.0390
Uncertainty avoidance (X) Gender inequity (Y) −0.3372 0.0322*
Conformity Gender inequity 0.4779 0.0006**
Notes: *Significance at 0.05 level; **Significance at 0.01 level.
Volume 11 Issue 1 (2025) 78 https://doi.org/10.36922/ijps.422