
Page 102 - IJPS-11-3
P. 102
International Journal of
Population Studies Male fertility in Uganda
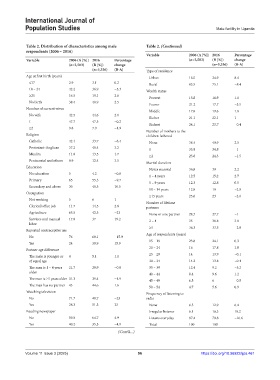
Table 2. Distribution of characteristics among male Table 2. (Continued)
respondents (2006 – 2016)
Variable 2006 (A [%]) 2016 Percentage
Variable 2006 (A [%]) 2016 Percentage (n=2,503) (B [%]) change
(n=2,503) (B [%]) change (n=5,336) (B‑A)
(n=5,336) (B‑A) Type of residence
Age at first birth (years) Urban 16.5 24.9 8.4
≤17 2.9 3.1 0.2 Rural 83.5 75.1 −8.4
18 – 24 42.2 36.9 −5.3 Wealth status
≥25 16.5 19.1 2.6 Poorest 15.8 16.9 1.1
No birth 38.4 40.9 2.5
Poorer 21.2 17.7 −3.5
Number of current wives
Middle 17.8 19.6 1.8
No wife 42.5 44.6 2.1
Richer 21.1 22.1 1
1 47.7 47.5 −0.2
Richest 24.1 23.7 −0.4
≥2 9.8 7.9 −1.9
Number of mothers to the
Religion children fathered
Catholic 42.1 33.7 −8.4 None 38.4 40.9 2.5
Protestant-Anglican 37.2 40.4 3.2 1 35.8 34.8 −1
Muslim 11.8 13.5 1.7 ≥2 25.8 24.3 −1.5
Pentecostal and others 8.9 12.4 3.5 Marital duration
Education
Never married 36.8 39 2.2
No education 5 4.2 −0.8
1 – 4 years 12.5 15.2 2.7
Primary 65 55.3 −9.7
5 – 9 years 12.3 12.8 0.5
Secondary and above 30 40.5 10.5
10 – 14 years 12.8 10 −2.8
Occupation
≥15 years 25.6 23 −2.6
Not working 5 6 1
Number of lifetime
Clerical/office job 11.7 14.5 2.8 partners
Agriculture 65.5 42.5 −23 None or one partner 28.7 27.7 −1
Services and manual 17.8 37 19.2 2 – 4 35 38.8 3.8
labor
≥5 36.3 33.5 −2.8
Reported contraceptive use
Age of respondents (years)
No 76 60.1 −15.9
15 – 19 23.8 24.1 0.3
Yes 24 39.9 15.9
20 – 24 16 17.8 1.8
Partner age difference
The male is younger or 4 5.1 1.1 25 – 29 14 13.9 −0.1
of equal age 30 – 34 14.2 13.8 −0.4
The man is 1 – 4 years 21.7 20.9 −0.8 35 – 39 12.4 9.2 −3.2
older 40 – 44 8.4 9.6 1.2
The man is ≥5 years older 31.3 29.4 −1.9 45 – 49 6.5 6 −0.5
The man has no partner 43 44.6 1.6 50 – 54 4.7 5.6 0.9
Watching television Frequency of listening to
No 71.7 48.7 −23 radio
Yes 28.3 51.3 23 None 6.5 12.9 6.4
Reading newspaper Irregular listener 6.1 16.3 10.2
No 59.8 64.7 4.9 Listens everyday 87.4 70.8 −16.6
Yes 40.2 35.3 −4.9 Total 100 100
(Cont’d...)
Volume 11 Issue 3 (2025) 96 https://doi.org/10.36922/ijps.461