
Page 101 - IJPS-11-3
P. 101
International Journal of
Population Studies Male fertility in Uganda
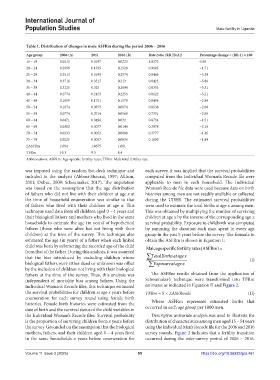
Table 1. Distribution of changes in male ASFRm during the period 2006 – 2016
Age group 2006 (A) 2011 2016 (B) Rate ratio (RR [B/A]) Percentage change = (RR‑1) × 100
15 – 19 0.0215 0.0197 0.0223 1.0372 0.08
20 – 24 0.2099 0.1939 0.1928 0.9185 −1.71
25 – 29 0.3513 0.3199 0.2974 0.8466 −5.39
30 – 34 0.3716 0.3517 0.313 0.8423 −5.86
35 – 39 0.3225 0.325 0.2694 0.8353 −5.31
40 – 44 0.2774 0.2453 0.2253 0.8122 −5.21
45 – 49 0.1859 0.1751 0.1579 0.8494 −2.80
50 – 54 0.1074 0.0973 0.0874 0.8138 −2.00
55 – 59 0.0774 0.0714 0.0569 0.7351 −2.05
60 – 64 0.0471 0.0496 0.032 0.6794 −1.51
65 – 69 0.0362 0.0077 0.0144 0.3978 −2.18
70 – 74 0.0233 0.0052 0.0088 0.3777 −1.45
75 – 79 0.0225 0.0057 0.0036 0.1600 −1.89
∑ASFRm 2.054 1.8675 1.681
TFRm 10.3 9.3 8.4
Abbreviations: ASFRm: Age-specific fertility rates; TFRm: Male total fertility rate.
was imputed using the random hot-deck technique and each survey, it was implied that the survival probabilities
included in the analysis (Abbasi-Shavazi, 1997; Allison, computed from the Individual Woman’s Recode file were
2001; Dubuc, 2009; Schoumaker, 2017). The imputation applicable to men in each household. The Individual
was based on the assumption that the age distribution Woman’s Recode file data were used because data on birth
of fathers who did not live with their children at age x at histories among men are not readily available or collected
the time of household enumeration was similar to that during the UDHS. The estimated survival probabilities
of fathers who lived with their children at age x. This were used to estimate the total births at age x among men.
technique used data from all children aged 0 – 4 years and This was obtained by multiplying the number of surviving
their biological fathers and mothers who lived in the same children at age x by the inverse of the corresponding age x
households to estimate the age (in years) of hypothetical survival probability. Exposure to childbirth was computed
fathers (those who were alive but not living with their by summing the duration each man spent in every age
children) at the time of the survey. This technique also group in the past 5 years before the survey. The formula to
estimated the age (in years) of a father when each linked obtain the ASFRm is shown in Equation 1:
child was born by subtracting the recorded age of the child MaleagespecificfertilityratesASFRm( )
from that of the father. During this analysis, it was assumed
that the bias introduced by excluding children whose TotalBirthsatagex (I)
biological fathers were either dead or unknown was offset Expposureatagex
by the inclusion of children not living with their biological
fathers at the time of the survey. Thus, this analysis was The ASFRm results obtained from the application of
independent of mortality bias among fathers. Using the Schoumaker’s technique were transformed into TFRm
Individual Woman’s Recode files, this technique estimated estimates as indicated in Equation II and Figure 2:
the survival probabilities for children at age x years before TFRm = 5 × ∑ASFRmale (II)
enumeration for each survey round using female birth
histories. Female birth histories were estimated from the Where ASFRm represents estimated births that
date of birth and the survival status of the child variables in occurred in each age group per 1000 men.
the Individual Woman’s Recode files. Survival probability Descriptive univariate analysis was used to illustrate the
is the proportion of surviving children born x years before distribution of characteristics among men aged 15 – 54 years
the survey. Grounded on the assumption that the biological using the Individual Man’s Recode file for the 2006 and 2016
mothers, fathers, and their children aged 0 – 4 years lived survey rounds. Figure 2 indicates that a fertility transition
in the same households x years before enumeration for occurred during the inter-survey period of 2006 – 2016.
Volume 11 Issue 3 (2025) 95 https://doi.org/10.36922/ijps.461