
Page 13 - IJPS-11-3
P. 13
International Journal of
Population Studies Role of nuptiality patterns to fertility
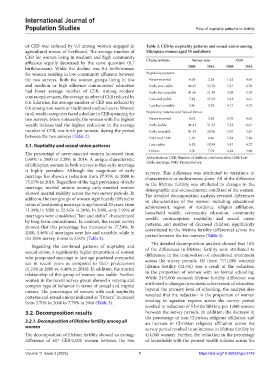
of CEB was reduced by 0.5 among women engaged in Table 3. CEB by nuptiality patterns and sexual union among
agricultural means of livelihood. The average number of Ethiopian women aged 35 and above
CEB for women living in medium and high community Characteristics Survey year CEB
affluence equally decreased by the same quantum (0.7
birth/woman). While the decline was 0.4 birth/woman 2000 2016 2000 2016
for women residing in low community affluence between Nuptiality patterns
the two surveys. Both the women groups living in low Never married 0.68 2.28 1.62 0.65
and medium or high affluence communities’ education Early and stable 46.47 53.79 7.31 6.59
had lower average number of CEB. Among modern Early but unstable 41.46 21.38 5.98 5.78
contraceptive users, the average number of CEB reduced by Late and stable 7.93 17.54 5.42 4.61
0.8. Likewise, the average number of CEB was reduced by
0.6 among non-users or traditional method users. Women Late but unstable 3.46 5.02 4.17 4.75
in all wealth categories faced a decline in CEB spanning the Nuptiality Patterns and Sexual Union
two surveys. More noticeably, the women with the highest Never married 0.62 2.28 0.78 0.65
wealth indexes had the highest reduction in the average Early stable 46.41 51.53 7.32 6.61
number of CEB, one birth per woman, during the period Early unstable 41.35 20.96 5.97 5.81
between the two surveys (Table 2). PMS and LSM 1.10 6.46 5.24 5.26
3.1. Nuptiality and sexual union patterns Late stable 6.82 10.99 5.47 4.27
Others 3.70 7.79 4.24 5.08
The percentage of never-married women increased from
0.68% in 2000 to 2.28% in 2016. A unique characteristic Abbreviations: CEB: Number of children ever born alive; LSM: Late
stable marriage; PMS: Premarital sex.
of Ethiopian women in both surveys is that early marriage
is highly prevalent. Although the magnitude of early surveys. This difference was attributed to variations in
marriage has shown a reduction from 87.93% in 2000 to characteristics or endowments alone. All of the difference
75.17% in 2016. Regardless of the high prevalence of early in the lifetime fertility was attributed to changes in the
marriage, marital unions among early-married women demographic and socioeconomic condition of the women.
showed marital stability across the two survey periods. In The detailed decomposition analysis revealed differences
addition, the two groups of women significantly differed in in characteristics of the women including educational
terms of postponing marriage to age beyond 20 years, from achievement, region of residence, religion affiliation,
11.39% in 2000 to 22.56% in 2016. In 2000, only 7.93% of household wealth, community education, community
marriages were considered “late and stable,” characterized wealth, contraception, nuptiality and sexual union
by long-term commitment. In contrast, the recent survey patterns, and number of deceased children significantly
showed that this percentage has increased to 17.54%. In contributed to the lifetime fertility differential across the
2000, 3.46% of marriages were late and unstable, while in period between the two surveys (Table 4).
the 2016 survey, it rose to 5.02% (Table 3).
The detailed decomposition analysis showed that 16%
Regarding the combined patterns of nuptiality and
sexual union, a significantly higher proportion of women of the differences in lifetime fertility were attributed to
differences in the composition of educational attainment
who postponed marriage to late age practiced premarital across the survey periods. Of these, 77/1,000 women’s
sex in recent years as compared to their predecessors lifetime fertility (12.5%) was a result of the reduction
(1.10% in 2000 vs. 6.46% in 2016). In addition, the marital
relationship of this group of women was stable. Further, in the proportion of women with no formal schooling.
women in the recent survey group showed a varying and While 21/1,000 women’s lifetime fertility difference was
complex type of behavior in terms of sexual and nuptial attributed to changes in women’s achievement of education
unions. The percentages of women with such nuptiality beyond the primary level of schooling, the analysis also
patterns and sexual unions indicated as “Others,” increased revealed that the reduction in the proportion of women
from 3.70% in 2000 to 7.79% in 2016 (Table 3). residing in agrarian regions across the survey period
resulted in reduction of 5 births lifetime per 1,000 women
3.2. Decomposition results between the survey periods. In addition, the decrease in
the percentage of non-Christian religious affiliation and
3.2.1. Decomposition of lifetime fertility among all an increase in Christian religious affiliation across the
women survey period resulted in an increase in lifetime fertility by
The decomposition of lifetime fertility showed an average 4/1,000 women. Further, the reduction in the percentage
difference of 617 CEB/1,000 women between the two of households with the poorest wealth indexes across the
Volume 11 Issue 3 (2025) 7 https://doi.org/10.36922/ijps.5749