
Page 14 - IJPS-11-3
P. 14
International Journal of
Population Studies Role of nuptiality patterns to fertility
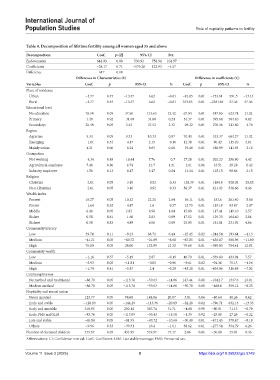
Table 4. Decomposition of lifetime fertility among all women aged 35 and above
Decomposition Coef. p>|Z| 95% CI Pct.
Endowments 644.93 0.00 530.92 758.94 104.57
Coefficients −28.17 0.71 −179.28 122.93 −4.57
Difference 617 0.00
Difference in Characteristics (E) Difference in coefficients (C)
Variables Coef. p 95% CI % Coef. p 95% CI %
Place of residence
Urban −3.77 0.45 −13.57 6.02 −0.61 −81.05 0.81 −753.61 591.5 −13.14
Rural −3.77 0.45 −13.57 6.02 −0.61 353.05 0.81 −2581.84 57.36 57.36
Educational level
No education 76.58 0.05 37.50 115.65 12.42 67.94 0.81 −487.85 623.74 11.02
Primary 1.49 0.92 −31.09 34.08 0.24 54.37 0.81 −395.64 504.40 8.82
Secondary+ 20.48 0.05 3.42 37.53 3.32 −29.32 0.81 −270.46 211.80 −4.76
Region
Agrarian 5.34 0.05 0.33 10.33 0.87 70.44 0.81 −523.37 664.27 11.42
Emerging −1.01 0.53 −4.17 2.15 −0.16 12.38 0.81 −90.42 115.20 2.01
Mainly urban 4.21 0.06 −0.24 8.65 0.68 −19.48 0.81 −180.89 141.93 −3.16
Occupation
Not working −4.34 0.48 −16.44 7.76 −0.7 27.28 0.81 −202.23 256.80 4.42
Agricultural employee 7.48 0.30 −6.74 21.7 1.21 −2.61 0.86 −33.51 28.28 −0.42
Industry employee 1.50 0.13 −0.47 3.47 0.24 −13.24 0.81 −125.15 98.66 −2.15
Religion
Christian −2.01 0.05 −3.10 −0.92 −0.33 −128.39 0.81 −1184.8 928.02 −20.82
Non-Christian −2.01 0.05 −3.10 −0.92 −0.33 58.37 0.81 −421.92 538.66 9.46
Wealth index
Poorest 16.27 0.05 10.32 22.21 2.64 −36.11 0.81 −333.6 261.40 −5.86
Poorer −1.64 0.32 −4.87 1.6 −0.27 −12.75 0.81 −119.18 93.67 −2.07
Middle 6.40 0.05 2.82 9.98 1.04 15.80 0.81 −117.41 149.10 2.57
Richer 0.58 0.61 −1.66 2.83 0.09 17.52 0.81 −129.35 164.40 2.84
Richest 0.58 0.83 −4.89 6.06 0.09 25.05 0.81 −181.81 231.92 4.06
Community literacy
Low 39.74 0.11 −9.23 88.71 6.44 −25.45 0.82 −244.54 193.64 −4.13
Medium −41.21 0.05 −60.72 −21.69 −6.68 −67.85 0.81 −636.67 500.96 −11.00
High 76.00 0.05 28.00 123.99 12.32 79.69 0.81 −595.03 754.41 12.92
Community wealth
Low −1.16 0.57 −5.19 2.87 −0.19 46.70 0.81 −339.60 433.01 7.57
Medium −5.93 0.05 −11.81 −0.05 −0.96 −9.61 0.82 −94.36 75.13 −1.56
High −1.74 0.41 −5.87 2.4 −0.28 −43.28 0.81 −403.06 316.49 −7.02
Contraceptive use
No method and traditional −86.70 0.05 −113.76 −59.63 −14.06 147.44 0.80 −1042.7 1337.6 23.91
Modern method −86.70 0.05 −113.76 −59.63 −14.06 −50.78 0.80 −460.6 359.12 −8.23
Nuptiality and sexual union
Never married 123.77 0.05 98.68 148.86 20.07 3.81 0.86 −40.64 48.26 0.62
Early and stable −128.83 0.05 −144.29 −113.36 −20.89 −82.28 0.82 −796.71 632.13 −13.33
Early and unstable 318.95 0.05 250.14 387.74 51.71 −4.88 0.90 −80.91 71.15 −0.79
Early PMS and SLM −83.76 0.05 −117.09 −50.43 −13.58 −1.35 0.92 −29.98 27.26 −0.22
Late and stable −65.84 0.05 −81.95 −49.72 −10.68 −50.48 0.81 −471.45 370.47 −8.19
Others −9.96 0.33 −30.31 10.4 −1.61 38.62 0.81 −277.54 354.79 6.26
Number of deceased children 475.97 0.05 431.95 519.97 77.17 2.86 0.86 −30.08 35.81 0.46
Abbreviations: CI: Confidence interval; Coef.: Coefficient; LSM: Late stable marriage; PMS: Premarital sex.
Volume 11 Issue 3 (2025) 8 https://doi.org/10.36922/ijps.5749