
Page 65 - IJPS-11-3
P. 65
International Journal of
Population Studies Age patterns of fertility in Ethiopia
The shrinkage values of all the models are small, indicating transition in Ethiopia and its regions is clearly in progress.
that the estimated and observed values of ASFRs are closely It is important to note that the EDHS ASFRs for regions,
aligned. The cross-validation findings further demonstrate especially at extreme ages, may not accurately represent
the high performance of the fitted polynomial models for fertility data due to smaller sample sizes. This limitation
ASFRs. Most of the ASFRs polynomial models that were prompted the development of the “MFT for Ethiopia,”
fitted have stability rates higher than 99%. The coefficient which assumes that regions in Ethiopia closely mirror the
of determination R, for these models exceeds 98% in terms national trends in overall fertility behavior and patterns
of stability except for Model 9. over time.
Moreover, all 117 observations revealed that the fitted To the best of our knowledge, no attempt has been
values of ASFRs obtained from the regression models made to develop an MFT for Ethiopia or any other
closely align with the WPP ASFR values. This comparison country in Africa. Thus, the present methodology sets a
was made possible by visually comparing the regression precedent for future studies, underscoring the uniqueness
model-based ASFRs with the WPP ASFR values (results of the present study. The present regression models do
not reported in this paper). not require any further modifications as the input covers
the entire fertility transition period of Ethiopia. The
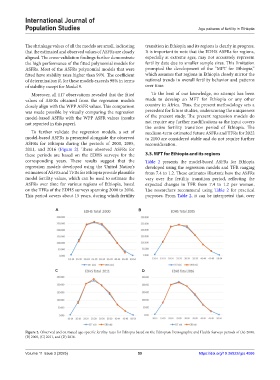
To further validate the regression models, a set of medium-term estimated future ASFRs and TFRs for 2022
model-based ASFRs is presented alongside the observed to 2100 are considered stable and do not require further
ASFRs for Ethiopia during the periods of 2000, 2005, reconsideration.
2011, and 2016 (Figure 2). These observed ASFRs for
these periods are based on the EDHS surveys for the 3.3. MFT for Ethiopia and its regions
corresponding years. These results suggest that the Table 2 presents the model-based ASFRs for Ethiopia
regression models developed using the United Nation’s developed using the regression models and TFR ranging
estimates of ASFRs and TFRs for Ethiopia provide plausible from 7.4 to 1.2. These estimates illustrate how the ASFRs
model fertility values, which can be used to estimate the vary over the fertility transition period, reflecting the
ASFRs over time for various regions of Ethiopia, based expected changes in TFR from 7.4 to 1.2 per woman.
on the TFRs of the EDHS surveys spanning 2000 to 2016. The researchers recommend using Table 2 for practical
This period covers about 15 years, during which fertility purposes. From Table 2, it can be interpreted that, over
A B
C D
Figure 2. Observed and estimated age-specific fertility rates for Ethiopia based on the Ethiopian Demographic and Health Surveys periods of (A) 2000,
(B) 2005, (C) 2011, and (D) 2016.
Volume 11 Issue 3 (2025) 59 https://doi.org/10.36922/ijps.4086