
Page 64 - IJPS-11-3
P. 64
International Journal of
Population Studies Age patterns of fertility in Ethiopia
was revised using the TFR and ASFR data from 1984 to developed using the TFR and ASFR data of Ethiopia from
2100, totaling 117 observations. 1984 to 2100, as provided by WPP 2022. The regression
A cubic polynomial regression was employed, assuming a models are as follows:
smooth, continuous relationship between the dependent and (i) ASFR (10 – 14) = (2.009598) + (-1.806028) × TFR +
2
3
2
independent variables. The approach provides the necessary (0.402741) × TFR + (0.013968) × TFR , R = 0.985
flexibility to model the data accurately and captures key data (ii) ASFR (15 – 19) = (−10.432059) + (4.713365) × TFR
3
2
2
features without overfitting. However, limitations include + (4.49149) × TFR + (−0.243894) × TFR , R = 0.998
complexity, interpretability issues, sensitivity to outliers, and (iii) ASFR (20 – 24) = (−86.171273) + (109.777812) ×
2
3
potential correlation between polynomial terms. TFR + (−14.118317) × TFR + (0.825919) × TFR ,
R = 0.998
2
2.2.2. Methods for model validation (iv) ASFR (25 – 29) = (33.959525) + (48.239717) × TFR +
2
3
2
To assess the stability of the cubic models developed in this (−1.639273) × TFR + (−0.017611) × TFR , R = 0.999
2
study, the cross-validity prediction power, ρ cvpp , is applied (v) ASFR (30 – 34) = (98.229064) + (−20.783838) ×
TFR + (13.459766) × TFR + (−1.001477) × TFR ,
2
3
(Gogoi & Deka, 2023). The formula is given in Equation II, R = 0.998
2
where k is the number of cases, is the number of variables (vi) ASFR (35 – 39) = (8.83864) + (20.504395) × TFR +
in the model (k ≤ n-2). (1.282253) × TFR + (0.005215) × TFR , R = 0.999
3
2
2
n 2 n 1
2
2
2
1
cvpp nn k 1 n k 2 ( 1 R ) (II) (vii) ASFR (40 – 44) = (−22.228452) + (21.81263) × TFR +
(−1.660136) × TFR + (0.240218) × TFR , R = 0.999
2
2
3
(viii) ASFR (45 – 49) = (−27.628117) + (20.694123) × TFR
The cross-validated R is the correlation between + (−3.059896) × TFR + (0.234623) × TFR , R = 0.985
3
2
2
observed ASFRs and expected ASFRs obtained from the (ix) ASFR (50 – 54) = (−3.104749) + (2.328573) × TFR +
fitting polynomial model. The higher the value of R, the (−0.396156) × TFR + (0.027416) × TFR , R = 0.968
2
2
3
better the model fits the data. For assessing the stability of the In all nine regression models, the total number of
coefficient of determination of the model, the relationship observations is always 117, and the R values, which
2
(1- shrinkage) was used, where the expression ρ 2 − R indicate the goodness of fit of the regression model, are
2
cvpp
represents the shrinkage of the model. Furthermore, to very high across all models. This suggests that the proposed
verify the overall measure of the significance of the model models are effective for estimating the ASFR based on the
and the significance of R, we chose the formula of F-test given TFR.
statistics as given below in Equation III.
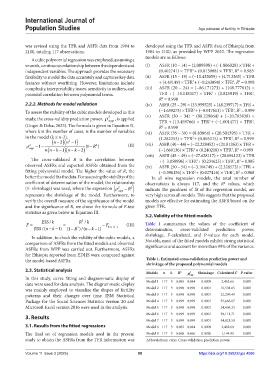
3.2. Validity of the fitted models
2
ESSk / R / k
F ~ F (III) Table 1 summarizes the values of the coefficient of
/(
2
RSSn k (1 R )/( n k )1 kn k, 1 determination, cross-validated prediction power,
)1
In addition, to check the validity of the cubic models, a shrinkage, F-calculated, and P-values for each model.
comparison of ASFRs from the fitted models and observed Notably, most of the fitted models exhibit strong statistical
ASFRs from WPP was carried out. Furthermore, ASFRs significance and account for more than 99% of the variance.
for Ethiopia reported from EDHS were compared against
the model-based ASFRs. Table 1. Estimated cross‑validation prediction power and
shrinkage of the proposed polynomial models
2.3. Statistical analysis Models n k R 2 ρ 2 Shrinkage Calculated F P‑value
In this study, curve fitting and diagrammatic display of cvpp
data were used for data analysis. The diagrammatic display Model 1 117 3 0.985 0.984 0.0009 2,453.66 0.000
was mainly employed to visualize the shapes of fertility Model 2 117 3 0.998 0.998 0.0001 16,501.65 0.000
patterns and their changes over time. IBM Statistical Model 3 117 3 0.998 0.998 0.0001 22,299.49 0.000
Package for the Social Sciences Statistics version 20 and Model 4 117 3 0.999 0.999 0.0001 35,665.07 0.000
Microsoft Excel version 2016 were used in the analysis. Model 5 117 3 0.998 0.998 0.0001 24,405.23 0.000
Model 6 117 3 0.999 0.999 0.0001 30,111.71 0.000
3. Results
Model 7 117 3 0.999 0.999 0.0001 34,821.58 0.000
3.1. Results from the fitted regressions Model 8 117 3 0.985 0.984 0.0009 2,402.69 0.000
The final set of regression models used in the present Model 9 117 3 0.968 0.966 0.0020 1,144.95 0.000
study to obtain the ASFRs from the TFR information was Abbreviations: cvpp: Cross-validation prediction power.
Volume 11 Issue 3 (2025) 58 https://doi.org/10.36922/ijps.4086