
Page 67 - IJPS-11-3
P. 67
International Journal of
Population Studies Age patterns of fertility in Ethiopia
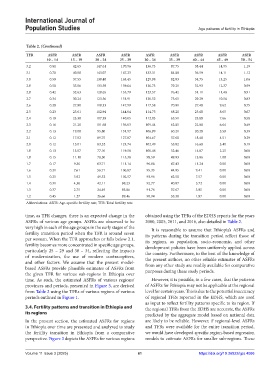
Table 2. (Continued)
TFR ASFR ASFR ASFR ASFR ASFR ASFR ASFR ASFR ASFR
10 – 14 15 – 19 20 – 24 25 – 29 30 – 34 35 – 39 40 – 44 45 – 49 50 – 54
3.2 0.81 42.65 147.61 170.96 136.73 87.75 38.44 14.95 1.19
3.1 0.70 40.08 143.07 167.23 133.31 84.88 36.59 14.11 1.12
3.0 0.59 37.55 138.40 163.45 129.98 82.03 34.75 13.25 1.06
2.9 0.50 35.06 133.59 159.64 126.73 79.21 32.93 12.37 0.99
2.8 0.42 32.63 128.65 155.79 123.57 76.42 31.11 11.48 0.91
2.7 0.34 30.24 123.56 151.91 120.52 73.65 29.29 10.56 0.83
2.6 0.28 27.90 118.33 147.99 117.58 70.91 27.48 9.62 0.75
2.5 0.23 25.61 112.94 144.04 114.75 68.20 25.68 8.65 0.67
2.4 0.19 23.38 107.39 140.05 112.03 65.51 23.88 7.66 0.58
2.3 0.16 21.20 101.68 136.03 109.44 62.85 22.08 6.64 0.49
2.2 0.13 19.08 95.80 131.97 106.99 60.21 20.28 5.59 0.39
2.1 0.12 17.02 89.75 127.87 104.67 57.60 18.48 4.51 0.29
2.0 0.12 15.01 83.52 123.74 102.49 55.02 16.68 3.40 0.19
1.9 0.13 13.07 77.10 119.58 100.46 52.46 14.87 2.25 0.08
1.8 0.15 11.18 70.50 115.38 98.59 49.93 13.06 1.08 0.00
1.7 0.17 9.36 63.71 111.14 96.88 47.43 11.24 0.00 0.00
1.6 0.21 7.61 56.71 106.87 95.33 44.95 9.41 0.00 0.00
1.5 0.25 5.92 49.52 102.57 93.96 42.50 7.57 0.00 0.00
1.4 0.31 4.30 42.11 98.23 92.77 40.07 5.72 0.00 0.00
1.3 0.37 2.75 34.49 93.86 91.76 37.67 3.85 0.00 0.00
1.2 0.45 1.27 26.66 89.46 90.94 35.30 1.97 0.00 0.00
Abbreviations: ASFR: Age-specific fertility rate; TFR: Total fertility rate.
time, as TFR changes, there is an expected change in the obtained using the TFRs of the EDHS reports for the years
ASFRs of various age groups. ASFRs are observed to be 2000, 2005, 2011, and 2016, also detailed in Table 2.
very high in each of the age groups in the early stages of the It is reasonable to assume that Ethiopia’s ASFRs and
fertility transition period when the TFR is around seven its patterns during the transition period reflect those of
per woman. When the TFR approaches or falls below 2.1, its regions, as population, socio-economic, and other
fertility becomes more concentrated in specific age groups, development policies have been uniformly applied across
particularly 25 – 29 and 30 – 34, reflecting the impacts the country. Furthermore, to the best of the knowledge of
of modernization, the use of modern contraceptives,
and other factors. We assume that the present model- the present authors, no other reliable estimates of ASFRs
from any other study are readily available for comparative
based ASFRs provide plausible estimates of ASFRs from
the given TFR for various sub-regions in Ethiopia over purposes during these study periods.
time. As such, the estimated ASFRs of various regions/ However, it is possible, in a few cases, that the patterns
provinces and periods, presented in Figure 3, are derived of ASFRs for Ethiopia may not be applicable at the regional
from Table 2 using the TFRs of various regions of various level for certain years. This is due to the potential inaccuracy
periods outlined in Figure 1. of regional TFRs reported in the EDHS, which are used
as input to reflect fertility patterns specific to its region. If
3.4. Fertility patterns and transition in Ethiopia and the regional TFRs from the EDHS are accurate, the ASFRs
its regions predicted by the aggregate model based on national data
In the present section, the estimated ASFRs for regions are likely to be reliable. However, if regional-level ASFRs
in Ethiopia over time are presented and analyzed to study and TFRs were available for the entire transition period,
the fertility transition in Ethiopia from a comparative we would have developed specific region-based regression
perspective. Figure 3 depicts the ASFRs for various regions models to estimate ASFRs for smaller sub-regions. These
Volume 11 Issue 3 (2025) 61 https://doi.org/10.36922/ijps.4086