
Page 81 - IJPS-11-4
P. 81
International Journal of
Population Studies Droughts and intimate partner violence
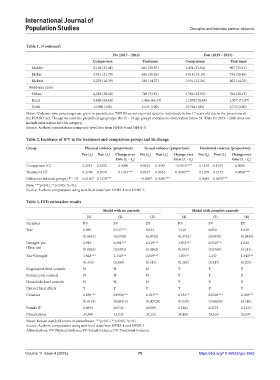
Table 1. (Continued)
Pre (2015 – 2016) Post (2019 – 2021)
Comparison Treatment Comparison Treatment
Middle 3,126 (22.48) 663 (29.93) 3,454 (21.94) 907 (33.31)
Richer 3,031 (21.79) 626 (28.26) 3,014 (19.14) 734 (26.96)
Richest 2,279 (16.39) 326 (14.72) 1,931 (12.26) 402 (14.76)
Residence place
Urban 4,228 (30.40) 749 (33.81) 3,766 (23.92) 766 (28.13)
Rural 9,680 (69.60) 1,466 (66.19) 11,978 (76.08) 1,957 (71.87)
Total 13,908 (100) 2,215 (100) 15,744 (100) 2,723 (100)
a
b
Notes: Column-wise percentages are given in parentheses. NFHS has not reported data for individuals below 17 years old due to the provisions of
c
the POCSO Act. Though we used the predefined age groups, the 15 – 19 age groups contains no observation below 18. Data for 2019 – 2020 does not
include information for this category.
Source: Authors’ computations using unit-level data from NFHS-4 and NFHS-5.
Table 2. Incidence of IPV in the treatment and comparison groups and its change
Group Physical violence (proportion) Sexual violence (proportion) Emotional violence (proportion)
Pre (t ) Post (t ) Change over Pre (t ) Post (t ) Change over Pre (t ) Post (t ) Change over
0
0
1
0
1
1
time (t – t ) time (t – t ) time (t – t )
1
0
1
1
0
0
Comparison (C) 0.2542 0.2592 0.0050 0.0624 0.0483 −0.0141*** 0.1193 0.1199 0.0006
Treatment (T) 0.2709 0.3970 0.1261*** 0.0537 0.0834 0.0296*** 0.1278 0.2174 0.0896***
Difference between groups (T – C) 0.0166* 0.1378*** −0.0087 0.0350*** 0.0085 0.0975***
Note: ***p<0.01, **p<0.05, *p<0.1.
Source: Authors’ computation using unit-level data from NFHS-4 and NFHS-5.
Table 3. DID estimation results
Model with no controls Model with complete controls
(1) (2) (3) (4) (5) (6)
Variables PV SV EV PV SV EV
Year 0.985 0.747*** 0.934 1.103 0.850 1.019
(0.0644) (0.0758) (0.0758) (0.0755) (0.0949) (0.0849)
Drought: yes 0.915 0.281*** 0.419*** 1.872*** 0.550*** 1.028
(Base: no) (0.0826) (0.0284) (0.0362) (0.197) (0.0769) (0.113)
Year*Drought 1.828*** 2.140*** 2.029*** 1.475** 1.247 1.442***
(0.335) (0.409) (0.315) (0.283) (0.247) (0.203)
Respondent-level controls N N N Y Y Y
Partner level controls N N N Y Y Y
Household-level controls N N N Y Y Y
District fixed effects Y Y Y Y Y Y
Constant 0.456*** 0.0936*** 0.184*** 0.184** 0.0204*** 0.188***
(0.0149) (0.00416) (0.00728) (0.130) (0.00828) (0.110)
Pseudo R 2 0.0944 0.0736 0.0569 0.2402 0.2274 0.2324
Observations 34,590 33,233 34,153 30,100 28,635 29,597
Notes: Robust standard errors in parentheses; ***p<0.01, **p<0.05, *p<0.1.
Source: Authors’ computation using unit-level data from NFHS-4 and NFHS-5.
Abbreviations: PV: Physical violence; SV: Sexual violence; EV: Emotional violence.
Volume 11 Issue 4 (2025) 75 https://doi.org/10.36922/ijps.3065