Page 79 - IJPS-11-4
P. 79

International Journal of
            Population Studies                                                    Droughts and intimate partner violence


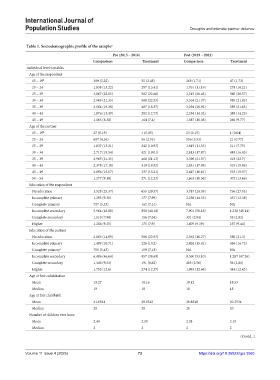
            Table 1. Sociodemographic profile of the sample a
                                                 Pre (2015 – 2016)             Post (2019 – 2021)
                                         Comparison           Treatment        Comparison          Treatment
            Individual level variables
             Age of the respondent
               15 – 19 b                 309 (2.22)          55 (2.48)          269 (1.71)         47 (1.73)
               20 – 24                   1,838 (13.22)       297 (13.41)        1,761 (11.19)      278 (10.21)
               25 – 29                   3,067 (22.05)       502 (22.66)        3,215 (20.42)      560 (20.57)
               30 – 34                   2,969 (21.35)       508 (22.93)        3,364 (21.37)      595 (21.85)
               35 – 39                   2,684 (19.30)       407 (18.37)        3,294 (20.92)      589 (21.63)
               40 – 44                   1,876 (13.49)       282 (12.73)        2,254 (14.32)      388 (14.25)
               45 – 49                   1,165 (8.38)        164 (7.4)          1,587 (10.08)      266 (9.77)
             Age of the partner
               15 – 19 b                 27 (0.19)           1 (0.05)           23 (0.15)          1 (0.04)
               20 – 24                   607 (4.36)          56 (2.53)          556 (3.53)         21 (0.77)
               25 – 29                   1,837 (13.21)       242 (10.93)        1,815 (11.53)      211 (7.75)
               30 – 34                   2,717 (19.54)       421 (19.01)        2,813 (17.87)      448 (16.45)
               35 – 39                   2,969 (21.35)       468 (21.13)        3,396 (21.57)      618 (22.7)
               40 – 44                   2,378 (17.10)       419 (18.92)        2,831 (17.98)      519 (19.06)
               45 – 49                   2,096 (15.07)       337 (15.21)        2,647 (16.81)      533 (19.57)
               50 – 54                   1,277 (9.18)        271 (12.23)        1,663 (10.56)      372 (13.66)
             Education of the respondent
               No education              3,528 (25.37)       655 (29.57)        3,787 (24.05)      736 (27.03)
               Incomplete primary        1,293 (9.30)        177 (7.99)         2,256 (14.33)      337 (12.38)
               Complete primary          727 (5.23)          162 (7.31)         NA                 NA
               Incomplete secondary      5,964 (42.88)       890 (40.18)        7,901 (50.18)      1,338 (49.14)
               Complete secondary        1,110 (7.98)        156 (7.04)         321 (2.04)         55 (2.02)
               Higher                    1,286 (9.25)        175 (7.9)          1,479 (9.39)       257 (9.44)
             Education of the partner
               No education              2,085 (14.99)       508 (22.93)        2,562 (16.27)      580 (21.3)
               Incomplete primary        1,489 (10.71)       226 (10.2)         2,426 (15.41)      456 (16.75)
               Complete primary c        755 (5.43)          159 (7.18)         NA                 NA
               Incomplete secondary      6,486 (46.64)       857 (38.69)        8,360 (53.10)      1,287 (47.26)
               Complete secondary        1,340 (9.63)        191 (8.62)         403 (2.56)         56 (2.06)
               Higher                    1,753 (12.6)        274 (12.37)        1,993 (12.66)      344 (12.63)
             Age at first cohabitation
               Mean                      19.27               18.16              19.12              18.53
               Median                    19                  18                 18                 18
             Age at first childbirth
               Mean                      21.0561             20.0342            20.8840            20.3534
               Median                    20                  20                 20                 20
             Number of children ever born
               Mean                      2.44                2.10               2.38               2.10
               Median                    2                   2                  2                  2

                                                                                                       (Contd...)


            Volume 11 Issue 4 (2025)                        73                        https://doi.org/10.36922/ijps.3065
   74   75   76   77   78   79   80   81   82   83   84