
Page 83 - IJPS-11-4
P. 83
International Journal of
Population Studies Droughts and intimate partner violence
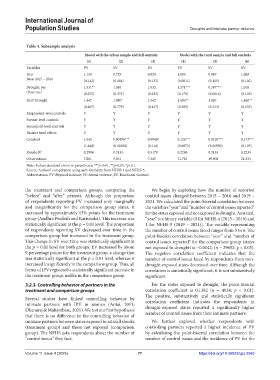
Table 4. Subsample analysis
Model with the urban sample and full controls Model with the rural sample and full controls
(1) (2) (3) (4) (5) (6)
Variables PV SV EV PV SV EV
Year 1.150 0.729 0.824 1.085 0.889 1.069
Base: 2015 – 2016 (0.143) (0.184) (0.133) (0.0811) (0.105) (0.102)
Drought: yes 1.531** 1.016 1.032 1.571*** 0.387*** 1.016
(Base: no) (0.272) (0.375) (0.232) (0.179) (0.0616) (0.126)
Year*Drought 1.447 1.980* 1.542 1.496** 1.067 1.460**
(0.407) (0.779) (0.417) (0.285) (0.233) (0.235)
Respondent-level controls Y Y Y Y Y Y
Partner level controls Y Y Y Y Y Y
Household-level controls Y Y Y Y Y Y
District fixed effects Y Y Y Y Y Y
Constant 1.042 0.00496*** 0.0946* 0.126*** 0.0210*** 0.173***
(1.448) (0.00628) (0.116) (0.0973) (0.00930) (0.105)
Pseudo R 2 0.2984 0.3135 0.3179 0.2286 0.2153 0.2239
Observations 7,861 5,561 7,345 21,781 19,908 21,523
Note: Robust standard errors in parentheses; ***p<0.01, **p<0.05, *p<0.1.
Source: Authors’ computation using unit-level data from NFHS-4 and NFHS-5.
Abbreviations: PV: Physical violence; SV: Sexual violence; EV: Emotional violence.
the treatment and comparison groups, comparing the We begin by exploring how the number of reported
“before” and “after” periods. Although the proportion control issues changed between 2015 – 2016 and 2019 –
of respondents reporting PV increased only marginally 2021. We calculated the point-biserial correlation between
and insignificantly for the comparison group states, it the variables “year” and “number of control issues reported”
increased by approximately 13% points for the treatment for the states exposed and not exposed to drought. As stated,
group (Andhra Pradesh and Karnataka). This increase was “year” is a binary variable (0 for NFHS-4 (2015 – 2016) and
statistically significant at the p = 0.01 level. The proportion 1 for NFHS-5 (2019 – 2021)). The variable representing
of respondents reporting SV decreased over time in the the number of control issues faced ranges from 0 to 6. The
comparison group but increased in the treatment group. point-biserial correlation between “year” and “number of
This change in SV over time was statistically significant at control issues reported” for the comparison group (states
the p = 0.01 level for both groups. EV increased by about not exposed to drought) is −0.0142; (n = 29652; p < 0.05).
9 percentage points for the treatment group, a change that The negative correlation coefficient indicates that the
was statistically significant at the p = 0.01 level, whereas it number of control issues faced by respondents from non-
increased insignificantly in the comparison group. Thus, all drought-exposed states decreased over time. Although the
forms of IPV registered a statistically significant increase in correlation is statistically significant, it is not substantively
the treatment group, unlike in the comparison group. significant.
3.2.3. Controlling behavior of partners in the For the states exposed to drought, the point-biserial
treatment and comparison groups correlation coefficient is 0.1382 (n = 4938; p < 0.01).
The positive, substantively and statistically significant
Several studies have linked controlling behavior by correlation coefficient indicates the respondents in
intimate partners with IPV in women (Antai, 2011;
Dhanaraj & Mahambare, 2021). We test our first hypothesis drought-exposed states reported a significantly higher
that there is no difference in the controlling behavior of number of control issues from their intimate partners.
intimate partners between states exposed to rainfall shocks We further explored whether respondents with
(treatment group) and those not exposed (comparison controlling partners reported a higher incidence of PV
group). The NFHS asks respondents about the number of by calculating the point-biserial correlation between the
“control issues” they face. number of control issues and the incidence of PV for the
Volume 11 Issue 4 (2025) 77 https://doi.org/10.36922/ijps.3065