
Page 82 - IJPS-11-4
P. 82
International Journal of
Population Studies Droughts and intimate partner violence
A B
C
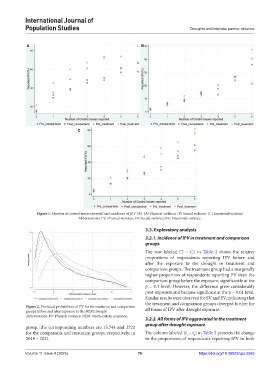
Figure 1. Number of control issues reported and incidence of IPV (%). (A) Physical violence. (B) Sexual violence. (C) Emotional violence
Abbreviations: PV: Physical violence; SV: Sexual violence; EV: Emotional violence.
3.2. Exploratory analysis
3.2.1. Incidence of IPV in treatment and comparison
groups
The row labeled (T – C) in Table 2 shows the relative
proportions of respondents reporting IPV before and
after the exposure to the drought in treatment and
comparison groups. The treatment group had a marginally
higher proportion of respondents reporting PV than the
comparison group before the exposure, significantly at the
p = 0.1 level. However, the difference grew considerably
post-exposure and became significant at the p = 0.01 level.
Similar results were observed for SV and EV, indicating that
the treatment and comparison groups diverged further for
Figure 2. Predicted probabilities of PV for the treatment and comparison
groups before and after exposure to the NEM drought all forms of IPV after drought exposure.
Abbreviations: PV: Physical violence; NEM: Northeastern monsoon.
3.2.2. All forms of IPV aggravated in the treatment
group after drought exposure
group. The corresponding numbers are 15,744 and 2723
for the comparison and treatment groups, respectively, in The column labeled (t – t ) in Table 2 presents the change
0
1
2019 – 2021. in the proportions of respondents reporting IPV in both
Volume 11 Issue 4 (2025) 76 https://doi.org/10.36922/ijps.3065