Page 80 - IJPS-11-4
P. 80

International Journal of
            Population Studies                                                    Droughts and intimate partner violence


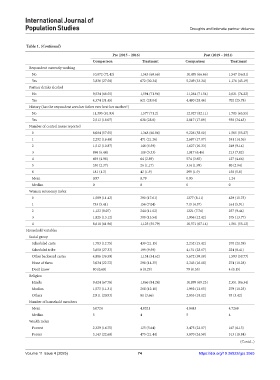
            Table 1. (Continued)
                                                 Pre (2015 – 2016)                      Post (2019 – 2021)
                                        Comparison            Treatment         Comparison         Treatment
             Respondent currently working
               No                       10,072 (72.42)       1,543 (69.66)      10,495 (66.66)    1,547 (56.81)
               Yes                      3,836 (27.58)        672 (30.34)        5,249 (33.34)     1,176 (43.19)
             Partner drinks alcohol
               No                       9,534 (68.55)        1,594 (71.96)      11,264 (71.54)    2,021 (74.22)
               Yes                      4,374 (31.45)        621 (28.04)        4,480 (28.46)     702 (25.78)
             History (has the respondent seen her father ever beat her mother?)
               No                       11,395 (81.93)       1,577 (71.2)       12,927 (82.11)    1,785 (65.55)
               Yes                      2,513 (18.07)        638 (28.8)         2,817 (17.89)     938 (34.45)
             Number of control issues reported
               0                        8,004 (57.55)        1,348 (60.86)      9,226 (58.60)     1,505 (55.27)
               1                        2,292 (16.48)        471 (21.26)        2,687 (17.07)     391 (14.36)
               2                        1,512 (10.87)        146 (6.59)         1,627 (10.33)     249 (9.14)
               3                        896 (6.44)           118 (5.33)         1,017 (6.46)      213 (7.82)
               4                        693 (4.98)           64 (2.89)          574 (3.65)        127 (4.66)
               5                        330 (2.37)           26 (1.17)          314 (1.99)        80 (2.94)
               6                        181 (1.3)            42 (1.9)           299 (1.9)         158 (5.8)
               Mean                     0.97                 0.79               0.93              1.24
               Median                   0                    0                  0                 0
             Woman autonomy index
               0                        1,589 (11.43)        390 (17.61)        1277 (8.11)       429 (15.75)
               1                        753 (5.41)           156 (7.04)         719 (4.57)        161 (5.91)
               2                        1,123 (8.07)         244 (11.02)        1221 (7.76)       257 (9.44)
               3                        1,825 (13.12)        300 (13.54)        1,956 (12.42)     375 (13.77)
               4                        8,618 (61.96)        1,125 (50.79)      10,571 (67.14)    1,501 (55.12)
            Household variables
             Social group
               Scheduled caste          1,703 (12.75)        439 (21.15)        2,232 (15.42)     570 (21.39)
               Scheduled tribe          3,650 (27.33)        199 (9.59)         4,151 (28.67)     224 (8.41)
               Other backward castes    4,886 (36.59)        1,134 (54.62)      5,672 (39.18)     1,593 (59.77)
               None of them             3,034 (22.72)        298 (14.35)        2,343 (16.18)     274 (10.28)
               Don’t know               80 (0.60)            6 (0.29)           79 (0.55)         4 (0.15)
             Religion
               Hindu                    9,424 (67.76)        1,866 (84.24)      10,899 (69.23)    2,351 (86.34)
               Muslim                   1,573 (11.31)        268 (12.10)        1,992 (12.65)     279 (10.25)
               Others                   2,911 (20.93)        81 (3.66)          2,853 (18.12)     93 (3.42)
             Number of household members
               Mean                     5.0724               4.8321             4.8443            4.7268
               Median                   5                    4                  5                 4
             Wealth index
               Poorest                  2,329 (16.75)        125 (5.64)         3,475 (22.07)     167 (6.13)
               Poorer                   3,143 (22.60)        475 (21.44)        3,870 (24.58)     513 (18.84)
                                                                                                       (Contd...)

            Volume 11 Issue 4 (2025)                        74                        https://doi.org/10.36922/ijps.3065
   75   76   77   78   79   80   81   82   83   84   85