
Page 113 - IJPS-11-5
P. 113
International Journal of
Population Studies Endowment insurance and family consumption in China
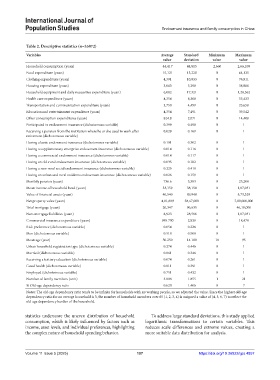
Table 2. Descriptive statistics (n=35872)
Variables Average Standard Minimum Maximum
value deviation value value
Household consumption (yuan) 44,417 44,815 2,660 2,66,100
Food expenditure (yuan) 15,121 13,220 0 64,125
Clothing expenditure (yuan) 4,391 10,033 0 76,911
Housing expenditure (yuan) 3,063 5,290 0 38,986
Household equipment and daily necessities expenditure (yuan) 6,082 17,321 0 1,28,562
Health care expenditure (yuan) 4,354 8,360 0 55,433
Transportation and communication expenditure (yuan) 3,750 4,499 0 25,650
Education and entertainment expenditure (yuan) 4,354 7,491 0 39,542
Other consumption expenditures (yuan) 824.8 2,071 0 14,400
Participated in endowment insurance (dichotomous variable) 0.399 0.490 0 1
Receiving a pension from the institution where he or she used to work after 0.029 0.169 0 1
retirement (dichotomous variable)
Having a basic endowment insurance (dichotomous variable) 0.101 0.302 0 1
Having a supplementary enterprise endowment insurance (dichotomous variable) 0.014 0.116 0 1
Having a commercial endowment insurance (dichotomous variable) 0.014 0.117 0 1
Having an old rural endowment insurance (dichotomous variable) 0.035 0.182 0 1
Having a new rural social endowment insurance (dichotomous variable) 0.225 0.418 0 1
Having an urban and rural residents endowment insurance (dichotomous variable) 0.026 0.159 0 1
Monthly pension (yuan) 736.6 3,393 0 25,200
Mean income of household head (yuan) 33,159 38,158 0 1,87,031
Value of financial assets (yuan) 40,540 89,948 0 5,73,329
Net property value (yuan) 4,01,809 38,67,000 0 7,00,000,000
Total mortgage (yuan) 20,347 96,635 0 46,19,000
Non-mortgage liabilities (yuan) 8,923 28,586 0 1,87,031
Commercial insurance expenditure (yuan) 995.700 2,939 0 18,478
Risk preference (dichotomous variable) 0.054 0.226 0 1
Men (dichotomous variable) 0.518 0.500 0 1
Mean age (year) 50.250 14.100 18 95
Urban household registration type (dichotomous variable) 0.274 0.446 0 1
Married (dichotomous variable) 0.861 0.346 0 1
Receiving a tertiary education (dichotomous variable) 0.074 0.261 0 1
Good health (dichotomous variable) 0.811 0.391 0 1
Employed (dichotomous variable) 0.751 0.432 0 1
Number of family members (unit) 3.808 1.855 1 21
% Old-age dependency ratio 0.620 1.406 0 7
Notes: The old-age dependency ratio tends to be infinite for households with no working people, so we adjusted the value. Since the highest old-age
dependency ratio for an average household is 3, the number of household members over 65 (1, 2, 3, 4) is assigned a value of (4, 5, 6, 7) to reflect the
old-age dependency burden of the household.
statistics underscore the uneven distribution of household To address large standard deviations, this study applied
consumption, which is likely influenced by factors such as logarithmic transformations to certain variables. This
income, asset levels, and individual preferences, highlighting reduces scale differences and extreme values, creating a
the complex nature of household spending behavior. more suitable data distribution for analysis.
Volume 11 Issue 5 (2025) 107 https://doi.org/10.36922/ijps.4857