
Page 114 - IJPS-11-5
P. 114
International Journal of
Population Studies Endowment insurance and family consumption in China
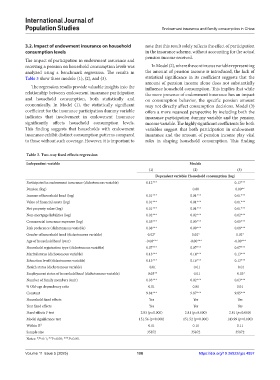
3.2. Impact of endowment insurance on household note that this result solely reflects the effect of participation
consumption levels in the insurance scheme, without accounting for the actual
pension income received.
The impact of participation in endowment insurance and
receiving a pension on household consumption levels was In Model (2), where the continuous variable representing
analyzed using a benchmark regression. The results in the amount of pension income is introduced, the lack of
Table 3 show three models: (1), (2), and (3). statistical significance in its coefficient suggests that the
amount of pension income alone does not substantially
The regression results provide valuable insights into the influence household consumption. This implies that while
relationship between endowment insurance participation the mere presence of endowment insurance has an impact
and household consumption, both statistically and on consumption behavior, the specific pension amount
economically. In Model (1), the statistically significant may not directly affect consumption decisions. Model (3)
coefficient for the insurance participation dummy variable offers a more nuanced perspective by including both the
indicates that involvement in endowment insurance insurance participation dummy variable and the pension
significantly affects household consumption levels. income variable. The highly significant coefficients for both
This finding suggests that households with endowment variables suggest that both participation in endowment
insurance exhibit distinct consumption patterns compared insurance and the amount of pension income play vital
to those without such coverage. However, it is important to roles in shaping household consumption. This finding
Table 3. Two‑way fixed effects regression
Independent variable Models
(1) (2) (3)
Dependent variable: Household consumption (log)
Participated in endowment insurance (dichotomous variable) 0.12*** 0.13***
Pension (log) 0.00 0.00**
Income of household head (log) 0.01*** 0.01*** 0.01***
Value of financial assets (log) 0.01*** 0.01*** 0.01***
Net property value (log) 0.01*** 0.01*** 0.01***
Non-mortgage liabilities (log) 0.02*** 0.02*** 0.02***
Commercial insurance expenses (log) 0.05*** 0.05*** 0.05***
Risk preference (dichotomous variable) 0.08*** 0.09*** 0.08***
Gender of household head (dichotomous variable) 0.02* 0.02* 0.02*
Age of household head (year) -0.00*** -0.00*** -0.00***
Household registration type (dichotomous variable) 0.07*** 0.07*** 0.07***
Marital status (dichotomous variable) 0.13*** 0.14*** 0.13***
Education level (dichotomous variable) 0.13*** 0.16*** 0.13***
Health status (dichotomous variable) −0.01 −0.01 −0.01
Employment status of household head (dichotomous variable) −0.03** −0.01 −0.03*
Number of family members (unit) 0.03*** 0.02*** 0.03***
% Old-age dependency ratio 0.01 0.01 0.01
Constant 9.84*** 9.87*** 9.85***
Household fixed effects Yes Yes Yes
Year fixed effects Yes Yes Yes
Fixed effects F test 2.83 (p=0.000) 2.81 (p=0.000) 2.81 (p=0.000)
Model significance test 151.56 (p=0.000) 151.52 (p=0.000) 143.99 (p=0.000)
Within R² 0.11 0.11 0.11
Sample size 35872 35872 35872
Notes: *P<0.1; **P<0.05; ***P<0.01.
Volume 11 Issue 5 (2025) 108 https://doi.org/10.36922/ijps.4857